Our system will evaluate the answer based on this AI-generated description.
The image is a line chart titled "IELTS Essay: Crime in the City Center" showing changes in three different areas of crime in New Port city center from 2003 to 2012. Three crime categories are displayed: Burglary, Car theft, and Robbery (theft from the person), with data points for each year from 2003 to 2012. Burglary starts at roughly 3750 incidents in 2003, decreasing to about 3500 in 2004, rising to almost 3750 in 2005, then decreasing steadily to around 600 in 2012. Car theft starts at 3500 incidents in 2003, decreases to roughly 3000 in 2004, fluctuates close to 2750 from 2005 to 2007, rises slightly to 3000 in 2008, then falls steadily to around 1500 in 2012. Robbery (theft from the person) begins at just below 1000 incidents in 2003, remains stable until a rise to approximately 1200 in 2006, then falls steadily to around 200 in 2012. The horizontal axis denotes the years, with specific years marked as 2003 through 2012, while the vertical axis documents the number of incidents from 0 to 4000 in increments of 500.
Given the complexity of the image, the above description may not be entirely accurate.
Skyrocket your IELTS band score by 1-2 points in under a month with our premium plan!
Note: Both the topic and the answer were created by one of our users.
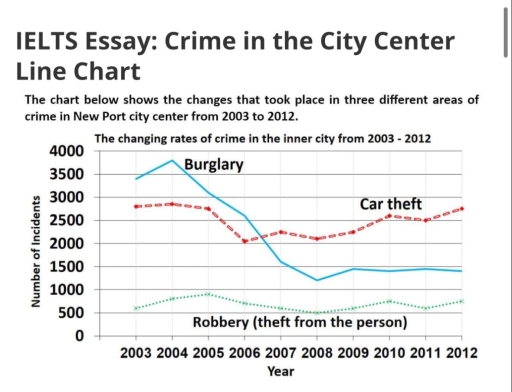
The graph provides information on the changing rates of crime in the inner city from 2008 to 2012. There are three major areas of crime: burglary, car theft, and robbery (theft from the person).
Overall, the number of incidents has been recorded above 500 over these years.
More than 3400 burglary incidents were recorded in 2003. In the next year, the rate of crime increased to 3800. Suddenly, after 2004, the crime rate decreased 10 percent every year until 2008. In 2009, it approximately increased to 1400, and it shows a steady increase over the year.
The crime recorded regarding car theft and robbery (theft from the person) both show a steady rate from 2003 to 2010. Car theft started at 2800 in 2003 and it stayed the same over the next two years. In 2005, it started decreasing to 2000. However, after that year, it started increasing and ended at the same level as in 2000. Finally, robbery has the lowest crime rate. Initially, it started at 700, then it rose by 100 records every year until 2005. Following that, it decreased by 100 records after 2005, ending in 2008. At the end, from 2003 to 2012, it had the same level of crime rate.
Word Count: 206
