Our system will evaluate the answer based on this AI-generated description.
The image displays a vertical bar graph titled "Citizens' Expenditure in The UK" representing percentages of total spending by age groups in the UK in 2004 across three categories: Food and Drink, Restaurant and Hotel, and Entertainment. "Under 30" spent approximately 15% on Food and Drink, 17% on Restaurant and Hotel, and 5% on Entertainment. Age group "31-45" had similar Food and Drink spending at about 15%, higher Restaurant and Hotel spending at approximately 22%, and slightly higher Entertainment expenditure at around 7%. The "46-60" age group displayed a decrease in Food and Drink spending to roughly 12%, a peak in Restaurant and Hotel spending at nearly 25%, and a slight increase in Entertainment spending to about 8%. "61-75" showed a significant drop in Food and Drink to around 8%, Restaurant and Hotel to approximately 17%, and Entertainment to nearly 6%. Finally, the "76+" age group showed a consistent Food and Drink percentage to "61-75", a decrease in Restaurant and Hotel to roughly 14%, and a sharp decline in Entertainment to under 5%. Overall, the graph indicates that as age increases, the percentage of total spending on Food and Drink and Entertainment generally decreases, while Restaurant and Hotel spending peaks in the middle age group before declining.
Given the complexity of the image, the above description may not be entirely accurate.
Skyrocket your IELTS band score by 1-2 points in under a month with our premium plan!
Note: Both the topic and the answer were created by one of our users.
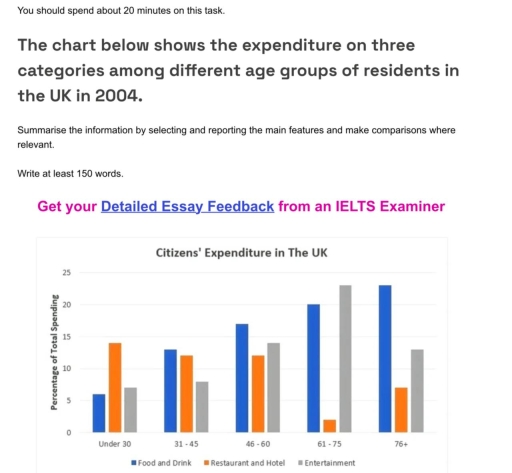
The bar chart illustrates how much money was spent on three categories by five different age groups of residents in the UK in 2004.
Overall, UK residents of all age groups generally spent the highest proportion of their money on food and drink. It is also evident that people aged 61 to 75 recorded the highest total expenditure across all three categories in 2004.
Regarding the elderly age brackets, the percentages of money allocated to food and drink among people aged 61–75 and over 76, as well as the figure for entertainment of the 61–75 group, were all approximately 22%. In contrast, entertainment spending by the over-76 group was almost half this figure, at around 13%. Meanwhile, both age groups allocated relatively small portions of their budgets to restaurants and hotels, with figures standing at about 3% for the 61–75 group and around 9% for those over 76. This indicates that older individuals in the Uk tended to focus on essential needs and leisure activities rather than eating out.
Word Count: 169
