Our system will evaluate the answer based on this AI-generated description.
The image shows a bar graph with data from 5 countries—Great Britain, Australia, New Zealand, United States, and Canada—across 6 decades—1930, 1940, 1950, 1960, 1970, 1980. Units on Y-axis range from 0 to 160 with intervals of 20. In 1930, Great Britain and Australia have identical highest values at 120, followed by New Zealand at 100, the United States at 80, and Canada at 60. In 1940, Australia leads at 160, Great Britain at 140, New Zealand at 120, the United States at 100, and Canada at 80. For 1950, Australia's value decreases to 140, Great Britain and New Zealand both at 120, the United States at 100, and Canada at 80. In 1960, New Zealand's data rises to 140, Great Britain at 120, Canada increases to 100, Australia drops to 100, and the United States remains at 100. The 1970 data show New Zealand and Great Britain both at 120, the United States at 100, Australia at 80, and Canada at 60. Finally, in 1980, Australia, United States, and Canada are at 100, Great Britain at 80, and New Zealand drops to 60.
Given the complexity of the image, the above description may not be entirely accurate.
Skyrocket your IELTS band score by 1-2 points in under a month with our premium plan!
Note: Both the topic and the answer were created by one of our users.
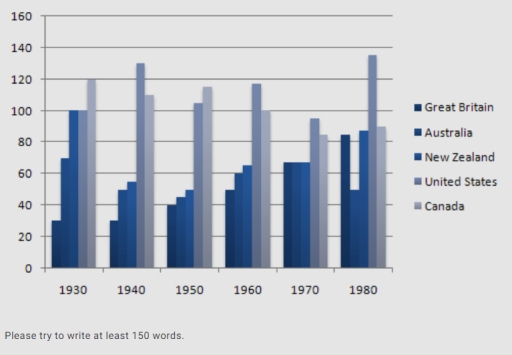
The given chart delineates how many individuals going to prison over a 50-year period starting from 1930 in five particular nations.
Looking from a comprehensive perspective, it is readily apparent that the US contributed the highest figures during most of the period surveyed. The chart witnessed a similar fluctuated trajectories.
Starting from 1930, number of imprisonment in Canada was the greatest at precisely 120 units, with US and New Zealand trailing equally at 100 units. Over the next 20 years , Canada’s amount of crime was surpassed twice by US in 1940 and 1960, accounting for 110 and 100 units respectively before it gradually decline to 90. While the US’s number oscilated until 1970 before tremedously incresed to merely 140.
On the other hand, New Zealand, Australia and the UK followed a same path where they decreased before having the same amount of crime in 1970. In the last year surveyed, while New Zealand and the UK both showed a substantially growth from roughly 65 to over 80 units, Australia dropped to below 50 units.
Word Count: 175
