Our system will evaluate the answer based on this AI-generated description.
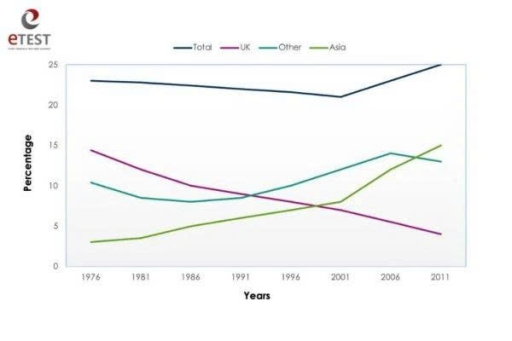
The image contains a line graph with a vertical axis labeled 'Percentage' from 0 to 25 and a horizontal axis labeled 'Years' with points at 1976, 1981, 1986, 1991, 1996, 2001, 2006, and 2011. There are four data series: Total, UK, Other, and Asia. For the 'Total' series, the approximate percentage values for each year are: 23% (1976), 22.5% (1981), 22% (1986), 21.5% (1991), 21.5% (1996), 21% (2001), 23% (2006), and 25% (2011). For the 'UK' series, the values are: 14.5% (1976), 12% (1981), 10% (1986), 8.5% (1991), 8% (1996), 7% (2001), 6% (2006), and 4% (2011). For the 'Other' series, the values are: 10.5% (1976), 8.5% (1981), 8% (1986), 9% (1991), 10.5% (1996), 12% (2001), 14% (2006), and 13% (2011). For the 'Asia' series, the values are: 3% (1976), 3.5% (1981), 5% (1986), 6.5% (1991), 7% (1996), 8% (2001), 12% (2006), and 15% (2011).
Given the complexity of the image, the above description may not be entirely accurate.
Skyrocket your IELTS band score by 1-2 points in under a month with our premium plan!
Note: Both the topic and the answer were created by one of our users.
The chart below illustrates the proportion of Australian born in others countries between 1976 and 2001
Overall, the percentage of Australian people who were born abroad fluctuated significantly over the period. Additionally, while the percentage of Australians born in Asia rose over the period, that of the UK declined steadily.
From 1976 to 1991,while the rate of Australians born in the UK decreased gradually from its peaked at 15% to 10% , that of Asia and others grew significantly, both reaching at 7% and 10% respectively. In contrast to the fluctuation of that data, the chart witnessed a stability in the total, at 22%.
From 1991 to 2011, the percentage of Australians born in the UK continued to lessen to the lowest point at 4% in 2011. In contrast, a significant growth was seen in that decade, from 7% to the highest point at 15% in 2011. Besides, the data of others fluctuated dramatically and ended at 13% in 2011. Because of the contrast in the trends of these data, the ratio of total stayed unstable and stopped at 25% in 2011
Word Count: 182
