Our system will evaluate the answer based on this AI-generated description.
The image is a bar chart displaying the percentage of different groups of people in Canada and their visitation to four places: Cinema, Theatre, Library, and Zoo. The groups are: New migrants born in other countries, New migrants born in English-speaking countries, and People born in Canada. For Cinema, New migrants born in other countries visited 60%, New migrants born in English-speaking countries visited 65%, and Born in Canada visited 70%. For Theatre, New migrants born in other countries visited 40%, New migrants born in English-speaking countries visited 45%, and Born in Canada visited 55%. For Library, New migrants born in other countries visited 50%, New migrants born in English-speaking countries visited 50%, and Born in Canada visited 50%. For Zoo, New migrants born in other countries visited 30%, New migrants born in English-speaking countries visited 25%, and Born in Canada visited 35%. The highest visitation percentage is for Cinema by Born in Canada at 70%, while the lowest is for Zoo by New migrants born in English-speaking countries at 25%.
Given the complexity of the image, the above description may not be entirely accurate.
Skyrocket your IELTS band score by 1-2 points in under a month with our premium plan!
Note: Both the topic and the answer were created by one of our users.
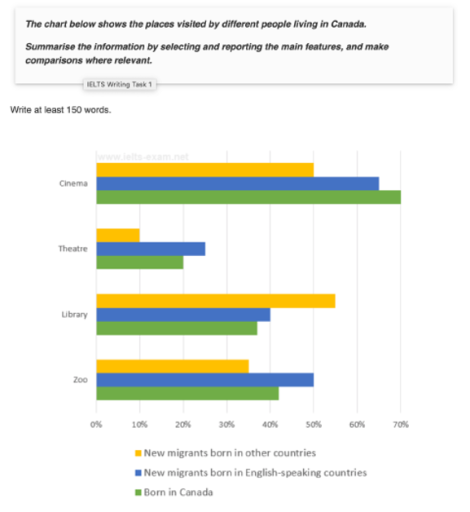
The bar charts illustrates the areas visited by different people living in Canada.
Overall, it is clear that migrants born in English-speakers countries enjoy going to the cinema, while the proportion for migrants from other countries was the lowest in theatre. In contrast, people in Canada demonstrate high proportion for cinema.
Regarding to the first two categories, people who born in English-speaking countries accounted for 65% in cinema, while the count for migrants who born in other countries comprised for 50%. In addition, the number of people from Canada was 70% in cinema. The data for theatre has 10% of migrants from other countries, and 20% from Canada. The proportion of migrants born in English-speaking countries was 25% in theatre.
Turning to the remaining categories, the high number of migrants from other countries made up 55% in library , and the data for migrants from Canada was 38%. In addition, the count for migrants from English countries accounted for 40% in library. Finally the counts for migrants from other countries, English countries and people from Canada comprised for 35%, 50% and 42% respectively.
Word Count: 183
