Our system will evaluate the answer based on this AI-generated description.
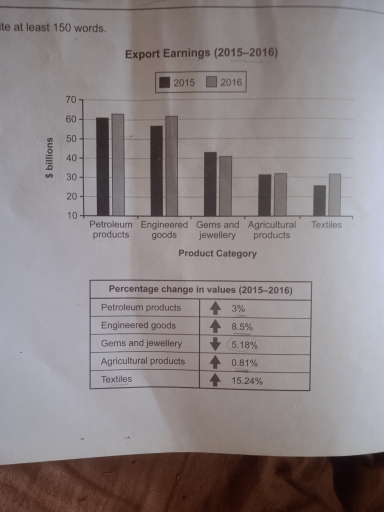
The image contains a bar chart with a title "Export Earnings (2015-2016)" and a table with a title "Percentage change in values (2015-2016)". The bar chart depicts five product categories along the x-axis: Petroleum products, Engineered goods, Gems and jewellery, Agricultural products, Textiles. For each category, there are two bars representing the export earnings in billions for the years 2015 and 2016. The y-axis ranges from 0 to 70 in increments of 10. In 2015, Petroleum products earned approximately 60 billion, Engineered goods roughly 55 billion, Gems and jewellery around 40 billion, Agricultural products close to 30 billion, and Textiles slightly above 20 billion. In 2016, the earnings for Petroleum products dropped to about 50 billion, Engineered goods declined to roughly 50 billion, Gems and jewellery decreased to about 38 billion, Agricultural products fell to slightly below 30 billion, and Textiles increased to approximately 25 billion. The table below the chart shows the percentage change in values for each category from 2015 to 2016: Petroleum products decreased by 3%, Engineered goods decreased by 8.5%, Gems and jewellery decreased by 5.18%, Agricultural products decreased by 0.81%, and Textiles increased by 15.24%.
Given the complexity of the image, the above description may not be entirely accurate.
Skyrocket your IELTS band score by 1-2 points in under a month with our premium plan!
Note: Both the topic and the answer were created by one of our users.
The provided bar graph and table present the export earnings of a country across different categories in 2015 and 2016, along with the percentage change in each category’s export value from 2015 to 2016.
Overall, the export earning in 2016 witnessed significant increases in the categories of petroleum products, engineered goods, agricultural products, and textiles, whereas gems and jewelry experienced a decrease.
In detail, the export value of petroleum products rose by 3% in 2016 compared to 2015, while engineered goods saw a substantial increase of 8.5% during the same period. However, the export value of gems and jewelry declined by 8.8% in 2016. On the other hand, agricultural products exhibited a positive growth of 6.18%, and textiles experienced substantial growth with a 15.24% increase in export earnings.
In summary, the country’s overall export earnings improved significantly across various categories in 2016, except for gems and jewelry, where there was a notable decline of 5.18% compared to the previous year.
Word Count: 160
