🔥 Today Only: Save 30% on Premium — Offer Ends Soon! - Upgrade Now!
Line Graph

Band 6+: the chart shows the proportion of working age adults in four countries from 1960 to 2050

Image for topic: the chart shows the proportion of working age adults in four countries from 1960 to 2050
Our system will evaluate the answer based on this AI-generated description.
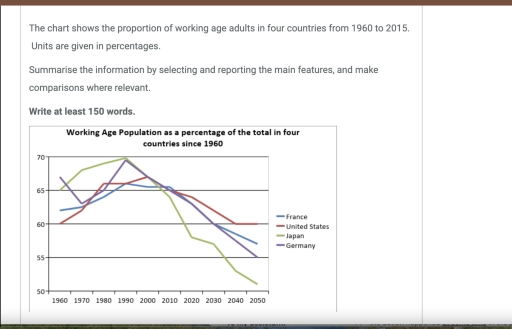
The image shows working-age population percentages from 1960-2050: in 1960, France at 62%, USA at 62%, Japan at 66%, Germany at 66%; in 1970, France at 64%, USA at 65%, Japan at 68%, Germany at 66%; in 1980, France at 66%, USA at 67%, Japan at 70%, Germany at 65%; in 1990, France at 67%, USA at 67%, Japan at 72%, Germany at 62%; in 2000, France at 68%, USA at 67%, Japan at 68%, Germany at 60%; in 2010, France at 68%, USA at 66%, Japan at 62%, Germany at 57%; in 2020, France projected 67%, USA projected 64%, Japan projected 56%, Germany projected 54%; in 2030, France projected 66%, USA projected 63%, Japan projected 52%, Germany projected 52%; in 2040, France projected 64%, USA projected 62%, Japan projected 51%, Germany projected 51%; in 2050, France projected 63%, USA projected 61%, Japan projected 50%, Germany projected 50%.
Given the complexity of the image, the above description may not be entirely accurate.
Note: Both the topic and the answer were created by one of our users.

The line graph gives information about percentage of working age adulte in France, United states, Japan and Germany throughout the Peried from 1960 to 2050. Overall, While the four countries exhibited a differet trends over the given period, all of them showed a downward trajectory. However, the rates od decline varied significantly among them.

As the grapg shows, United States and France started at 60 and around 62 in 1960, followed by gradual rise to more than 65 in 1990. United States continued to increase slightly to almost 67 in 2000, while France significantly decreased in 2000s. However, both figures dropped dramatically to reach 60 and nearly 56 at the end of the given period.

By contrast, Japan and Germany began at 65 and approximately 66 in 1960. Japan grew steadily to 70 in 1990, then went down quickly to around 51 in 2050. Regarding Germany, it decreased rapidly to around 63 in 1970, then jumped to 70 in 1990. It fell quickly to 55 in 1950.

Word Count: 167

Answers On The Same Topic:

the chart shows the proportion of working age adults in four countries from 1960 to 2050

The line graph compares the percentage of working-age people in France, the United States, Japan and Germany from 1960 to 2015, with projections to 2050. Overall, all four countries experienced fluctuations, but the general trend shows a decline in the proportion of working-age population in the long term. Japan is expected to see the most […]

the chart shows the proportion of working age adults in four countries from 1960 to 2050

The given chart illustrates information and compares the percentage of working age adults in four selected countries. Overall, what stands out from the chart is that the population that have capability to work through the years varies between countries. Importantly, in all four countries France, the US, Japan, and Germany the percentage of people who […]

the chart shows the proportion of working age adults in four countries from 1960 to 2050

The provided line graph below illustrates the percentage of working people in 4 countries located in different continents between 1960 and 2050. Overall, whilst in the beginning of the period Germany and Japan were the 2 countries with the highest proportion of people working, however, in the end both of the numbers dropped severely to […]

See All

Other Topics:

The graph below shows the number of enquiries received by the Tourist Information Office in one city over a six-month period in 2011. Summarise the information by selecting and reporting the main features, and make comparisons where relevant.

The line graph illustrates the quantity of inquiries which were received by the Tourist Information Office in the city from January to June 2011. Overall, the number of enquiries obtained in person and by telephone increased over the entire period. A gradual decrease was seen in sending by letter. In January, there were just above […]

The line graph below gives Information on the numbers of participants for different activities In Melbourne, Australia for the period 2000-2020

The provided line graph illustrates the participation amounts of different activities at a social centre over 20 years in Melbourne, Australia, from 2000-2020. Overall, it is noticeable that the film club remained the most well-known activity during these years, while amateur dramatics decreased gradually. Additionally, the table tennis also increased sharply since 2010. Looking at […]

Topic: The graph below gives information about U.S. government spending on research between 1980 and 2008.

The line graph provides information about US government expenditure on five different areas ( Health , space, energy, general science and others) from 1980 to 2008 . Overall , it is clear that the US government spent the largest amount of money on Health while the least amount of money spent on researching general science, […]

The graph shows the amount of money spent on books in Germany, France, Italy and Austria between 1995 and 2005. Summarise the information by selecting and reporting the main features, and make comparisons where relevant.

The graph illustrates the amount of money spent on books in four different European countries between 1995 and 2005. Overall, Germany had the highest figure throughout the period. Moreover, the proportion of money increased in all countries over the period. In 1995, the figure for Austria stood at 30 percent, while Italy was far ahead […]

The line graph below shows the percentage of people who used the internet in three countries between 2000 and 2020. • Country A: 10% (2000), 30% (2005), 55% (2010), 75% (2015), 90% (2020) • Country B: 5% (2000), 20% (2005), 45% (2010), 60% (2015), 70% (2020) • Country C: 15% (2000), 35% (2005), 50% (2010), 55% (2015), 60% (2020)

The line graph illustrates the proportion of people who used the internet in three various countries from 2000 to 2020. On the whole, internet users increased significantly in all three countries throughout the period. Country A had the highest percentage of internet users, while Country C remained the lowest. In 2000, approximately 20% of people […]

See All
We have detected unusual activity on your device.
Please verify your identity to continue.
Note: This verification step won't sign you in. If you have a premium account, please log in to access the service as usual.
Google/Gmail Verification
Or verify using Email/Code
We've sent a verification code to:
youremail@gmail.com (Not your email?)
Enter it below to complete the verification process.
Ensure your email address is correct, your inbox is not full, and you check your spam folder. If no email arrives, consider using an alternative email.
You will need a Premium plan to perform your action!
Note: If you already have a premium account, please log in to access our services as usual.

Plans & Pricing

Our mission is to make quality education accessible for everyone.
However, to keep our hardworking team running and this service alive, we genuinely need your support!
By opting for a premium plan, not only do you sustain us in achieving the mission, but you also unlock advanced features to enrich your learning experience.

Free

For learners who aren't pressed for time

What's included on Free
100+ Cambridge IELTS Tests
Instant IELTS Writing Task 1 & 2 Evaluation (2 times/month)
Instant IELTS Speaking Part 1, 2, & 3 Evaluation (2 times/month)
Instant IELTS Writing Task 1 & 2 Essay Generator (2 times/month)
500+ Dictation & Shadowing Exercises
100+ Pronunciation Exercises
Flashcards
Other Advanced Tools

Premium

For those serious about advancing their English proficiency, and for IELTS candidates aspiring to boost their band score by 1-2 points (especially in writing & speaking) in just 30 days or less

What's included on Premium
Save Your IELTS Test Progress & Analyze Mistakes By Question Type
Save Your Own Flashcard Sets & Use Them On Any Device
Unlock All Courses, IELTS Tests, Section & Part Practice
Unlimited AI Conversations
Unlimited AI Writing Enhancement Exercises
Unlimited IELTS Writing Task 1 & 2 Evaluation
Unlimited IELTS Speaking Part 1, 2, & 3 Evaluation
Checked Answers Will Not Be Published
Unlimited IELTS Writing Task 1 & 2 Essay Generator
Unlimited IELTS Speaking Part 1, 2, & 3 Sample Generator
Unlimited Usage Of Advanced Tools & AI Features
Priority Support within 24h (12-month plan only)

Due to the nature of our service and the provided free trials, payments are non-refundable.