Our system will evaluate the answer based on this AI-generated description.
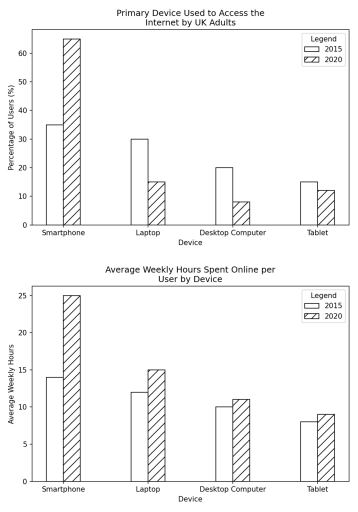
The image features two vertical bar charts comparing data between 2015 and 2020 across four device categories: Smartphone, Laptop, Desktop Computer, and Tablet. The first chart, titled "Primary Device Used to Access the Internet by UK Adults", measures "Percentage of Users (%)" on the y-axis from 0 to 60 with grid intervals of 10: for Smartphone, 2015 is 35% and 2020 is 65%; for Laptop, 2015 is 30% and 2020 is 15%; for Desktop Computer, 2015 is 20% and 2020 is 8%; for Tablet, 2015 is 15% and 2020 is 12%. The second chart, titled "Average Weekly Hours Spent Online per User by Device", measures "Average Weekly Hours" on the y-axis from 0 to 25 with grid intervals of 5: for Smartphone, 2015 is 14 hours and 2020 is 25 hours; for Laptop, 2015 is 12 hours and 2020 is 15 hours; for Desktop Computer, 2015 is 10 hours and 2020 is 11 hours; for Tablet, 2015 is 8 hours and 2020 is 9 hours.
Given the complexity of the image, the above description may not be entirely accurate.
Skyrocket your IELTS band score by 1-2 points in under a month with our premium plan!
Note: Both the topic and the answer were created by one of our users.
The bar charts gives information about the four main devices used to browse on internet by UK adults and how many weekly hours users spent online between 2015 and 2020.
Overall, smartphone is the device with the biggest access in both years and also the one adults spent more weekly hours using.
The first bar chart gives the percentage of users using four differents devices. It is clear that, smartphone experienced the highest increase, it went from approximately 40% users in 2015 to more than 60% in 2020. However, the other three devices registered a decline. The second most popular device in both years was laptop in 2015, the percentage of adults owning was 30% and it went down to 15%. Followed by desktop computer, that was 20% in the first year and after 5 years less than 10%. In addition, tablet also had a decrease but remained between 10 and 20% of users.
As shown in the second chart, the amount of hours adults spent online, increased after 5 years. In 2015, per week an adult spent almost 15 hours using smartphone, while in 2020 surged reaching 25 hours weekly. Laptop, desktop computer and tablet also had a growth but without significant changes in the number spent online.
Word Count: 209
