🔥 Today Only: Save 30% on Premium — Offer Ends Soon! - Upgrade Now!
Multiple Graphs

Band 5+: The charts below show the distribution of the world's water and the use of water in three countries. Summarise the information by selecting and reporting the main features, and make comparisons where relevant.

Image for topic: The charts below show the distribution of the world's water and the use of water in three countries. Summarise the information by selecting and reporting the main features, and make comparisons where relevant.
Our system will evaluate the answer based on this AI-generated description.
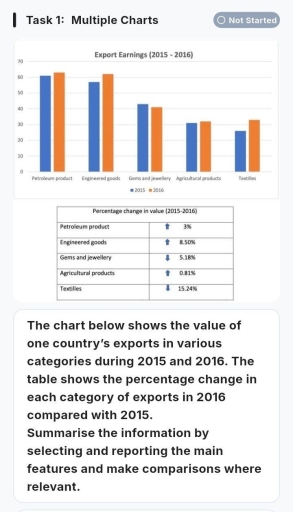
The image features a vertical bar chart and a table. The bar chart is titled "Export Earnings (2015 - 2016)" with a vertical axis scaled from 0 to 70 in increments of 10, a legend for 2015 and 2016, and five product categories: Petroleum product (approximately 61 in 2015, 63 in 2016), Engineered goods (approximately 57 in 2015, 62 in 2016), Gems and jewellery (approximately 43 in 2015, 41 in 2016), Agricultural products (approximately 31 in 2015, 32 in 2016), and Textiles (approximately 26 in 2015, 33 in 2016). Beneath it, a table titled "Percentage change in value (2015-2016)" lists the five categories alongside directional arrows and percentage values: Petroleum product (upward arrow, 3%), Engineered goods (upward arrow, 8.50%), Gems and jewellery (downward arrow, 5.18%), Agricultural products (upward arrow, 0.81%), and Textiles (downward arrow, 15.24%).
Given the complexity of the image, the above description may not be entirely accurate.
Note: Both the topic and the answer were created by one of our users.

The bar chart illustrates the value of one country’s export in different categories between 2015 and 2016 , while table shows the percentage change in each category of expert in same years.

Overall, it is worth noting that petroleum products rose over the period . Notably,petroleum product showed very small growth,in contrast enginnering goods with same level – showed the largest increase.

Out of 5 given categrories, petroleum product had the highest level in 2016. Following some wat behind came engineering goods 60 percentages of earnings and from gems and jewellery fourty percentages. Agricultural was the product to show the same proportion in each period. In addition , Textiles was increase to around 30% than 25% in 2015.

As regards the percentage change, it increase in all the given categories in years 2015 and 2016 .The petroleum and agricultural products saw the smallest growth, at 3% and 0.81% respectively. This was in stark contrast to other two categories which show dramatic double fall ,textilles by 15.24% , gems and jewellery products by 8,50%.

Word Count: 173

Other Topics:

The chart shows the difference in how three countries learn English in 2010 and 2015.

The pie chart show proportions of people in three countries who learned English through evening classes, online courses and studying abroad in 2010 and 2015. Overall, it is clear that while the figures for online learning witnessed an upward trend, the opposite was true for evening classes, leading to a significant narrowing of the gap […]

The line graph and table below give information about tourism growth and the number of ride-hailing users in four Vietnamese cities between 2015 and 2025. Summarise the information by selecting and reporting the main features, and make comparisons where relevant.

The graph and the table illustrate the growth in tourism and ride-hailing demand in four Vietnamese cities include Ho Chi Minh city, Da Nang, Ha Noi and Nha Trang over a 10-year period. Overall, it is clear that tourism growth and ride-hailing usage experienced an upward trend from 2015 to 2019 but then both of […]

The line graph and table below give information about tourism growth and the number of ride-hailing users in four Vietnamese cities between 2015 and 2025. Summarise the information by selecting and reporting the main features, and make comparisons where relevant.

The graph and the table illustrate the growth in tourism and ride-hailing demand in four Vietnamese cities include Ho Chi Minh city, Da Nang, Ha Noi and Nha Trang over a 10-year period. Overall, it is clear that toursim growth and ride-hailing usage experienced an upward trend from 2015 to 2019 but then both of […]

The line graph and table below give information about tourism growth and the number of ride-hailing users in four Vietnamese cities between 2015 and 2025. Summarise the information by selecting and reporting the main features, and make comparisons where relevant.

The graph and the table illustrate the growth in tourism and ride-hailing demand in four Vietnamese cities include Ho Chi Minh city, Da Nang, Ha Noi and Nha Trang over a 10-year period. Overall, it is clear that toursim growth and ride-hailing usage experienced an upward trend from 2015 to 2019 but then both of […]

The pie chart below shows how international tourists spent their money in one country in 2025, and the bar chart shows the number of tourists, in millions, arriving from five countries in 2015 and 2025. Summarise the information by selecting and reporting the main features, and make comparisons where relevant.

The given charts represent the information about the proportion of different categories where foreigners spend their money during the year 2025 and depicts the number of tourists arrived in a country between year 2015 and 2025. Overall, tourists have spend most of their money onn accommodation and least spent on visiting attections and tours. Furthermore, […]

The chart below shows the reason for travel and the main issue for traveling public in the US in 2009.

The pie chart and bar chart illustrate causes for commuting and the main problems of the public travelling in the us in 2009. Considering from an overall perspective,the majority of commuters travel for their work.However,less number of traveller travel due to visit their friend home and reletive home.Addtionally,the main reason of public transportations was higher […]

See All
We have detected unusual activity on your device.
Please verify your identity to continue.
Note: This verification step won't sign you in. If you have a premium account, please log in to access the service as usual.
Google/Gmail Verification
Or verify using Email/Code
We've sent a verification code to:
youremail@gmail.com (Not your email?)
Enter it below to complete the verification process.
Ensure your email address is correct, your inbox is not full, and you check your spam folder. If no email arrives, consider using an alternative email.
You will need a Premium plan to perform your action!
Note: If you already have a premium account, please log in to access our services as usual.

Plans & Pricing

Our mission is to make quality education accessible for everyone.
However, to keep our hardworking team running and this service alive, we genuinely need your support!
By opting for a premium plan, not only do you sustain us in achieving the mission, but you also unlock advanced features to enrich your learning experience.

Free

For learners who aren't pressed for time

What's included on Free
100+ Cambridge IELTS Tests
Instant IELTS Writing Task 1 & 2 Evaluation (2 times/month)
Instant IELTS Speaking Part 1, 2, & 3 Evaluation (2 times/month)
Instant IELTS Writing Task 1 & 2 Essay Generator (2 times/month)
500+ Dictation & Shadowing Exercises
100+ Pronunciation Exercises
Flashcards
Other Advanced Tools

Premium

For those serious about advancing their English proficiency, and for IELTS candidates aspiring to boost their band score by 1-2 points (especially in writing & speaking) in just 30 days or less

What's included on Premium
Save Your IELTS Test Progress & Analyze Mistakes By Question Type
Save Your Own Flashcard Sets & Use Them On Any Device
Unlock All Courses, IELTS Tests, Section & Part Practice
Unlimited AI Conversations
Unlimited AI Writing Enhancement Exercises
Unlimited IELTS Writing Task 1 & 2 Evaluation
Unlimited IELTS Speaking Part 1, 2, & 3 Evaluation
Checked Answers Will Not Be Published
Unlimited IELTS Writing Task 1 & 2 Essay Generator
Unlimited IELTS Speaking Part 1, 2, & 3 Sample Generator
Unlimited Usage Of Advanced Tools & AI Features
Priority Support within 24h (12-month plan only)

Due to the nature of our service and the provided free trials, payments are non-refundable.