Our system will evaluate the answer based on this AI-generated description.
The image displays two line graphs illustrating data from 1920-2019. The top graph shows the percentage of households with three types of electrical appliances: washing machines (starting at approximately 0% in 1920, reaching around 60% in 1960, approximately 90% in 1980, and stabilizing around 100% by 2000), refrigerators (beginning near 0% in 1920, about 25% in 1960, around 80% by 1980, and close to 100% by 2000), and vacuum cleaners (initiating at nearly 0% in 1920, around 30% in 1960, roughly 60% in 1980, and achieving near 100% by 2000). The bottom graph depicts the number of hours of housework per week, starting at about 50 hours in 1920, decreasing to around 30 hours in 1960, about 20 hours in 1980, and further reducing to approximately 5 hours by 2019. The plots demonstrate a positive correlation between the proliferation of electrical appliances and the reduction in hours spent on household tasks over the century.
Given the complexity of the image, the above description may not be entirely accurate.
Skyrocket your IELTS band score by 1-2 points in under a month with our premium plan!
Note: Both the topic and the answer were created by one of our users.
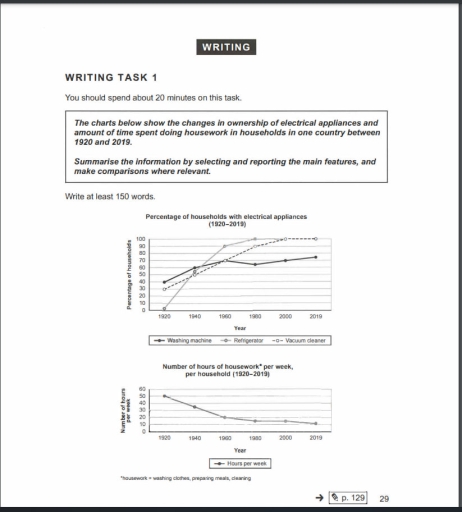
The two line graphs below demonstrate the percentage of households with electrical appliances and number of hours of housework per week per household in the same country during 1920 and 2019.
First of all, the amount of ownerships with electrical appliances used was exactly 0% of refrigerators in 1920, while vacuum cleaner shows 30% and washing machine was 40%. After 2 decades passed, the percentage of refrigerators rapidly increased to approximately 55%, vacuum cleaner and washing machine illustrate the growth of their usage for 20%, expressing 40 and 60%. During the following years, the indicator of refrigerator rose steadily by reaching 90% in 1960 and 100% between 1980 and 2019. However, the growth of the vacuum cleaner continued to uplift to 20% every 20 years and indicates also 100% in the beginning of the 21st century. The data for washing machine changed slightly between 60-70% during the next 80 years.
Afterwards, number of hours spent on the housework per week depicts the gradual decrease with 50 hours in 1920 and decline to only 10 hours in 2019.
Overall, during one century all data for electrical devices provided an increase, while the hours for housework only decrease.
Word Count: 196
