🔥 Today Only: Save 30% on Premium — Offer Ends Soon! - Upgrade Now!
Pie Chart

Band 6+: The charts give information about employment in the UK in 1998 and 2012.

Image for topic: The charts give information about employment in the UK in 1998 and 2012.
Our system will evaluate the answer based on this AI-generated description.
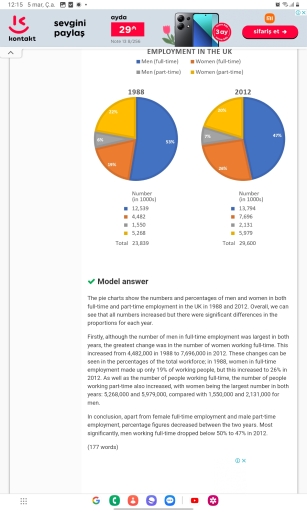
The image contains two pie charts comparing the number of men and women in full-time and part-time employment in the UK in 1988 and 2012 respectively. In 1988, there were a total of 23,180 individuals employed, with men in full-time work accounting for the majority at 12,650, followed by women in full-time work at 4,899, men in part-time work at 1,298, and women in part-time work at 4,332. In 2012, the total employed individuals increased to 25,259 with men in full-time work slightly reduced to 12,566, women in full-time work increased to 7,246, men in part-time work increased to 2,374, and women in part-time work increased to 3,073. The data demonstrates that over the 24 year period, there was a decrease in the proportion of men in full-time employment and an increase in all other categories, with a significant rise in the number of women in full-time employment.
Given the complexity of the image, the above description may not be entirely accurate.
Note: Both the topic and the answer were created by one of our users.

The given pie charts show the numbers of UK people employed (women and men) in 1988 and 2012.

Overall, it can be clearly seen that in both years, the vast majority of people in the UK worked in a full-time job, however, by 2012 the figure of individuals in part-time jobs increased.

To commence, in 1988, the proportion of men engaged in full-time jobs accounted for just over a half (12 thousand people). In contrast, the women ratio was about 19%, which represented just under 5,5 thousand people. However, in part-time employment women had a higher percentage than men, 22% and 6% respectively ( more than 4,5 thousand and just over 1,5 thousand people)

By 2012, the chart shows that the ratio of male in full-time working fell to just under a half (quite less than 14 thousand people), while the female proportion grew to one quarter ( over 7,5 thousand people). Moreover, the percentage of men in part-time employment increased to 7% ( almost 2 thousand people), whereas women rate decreased to a fifth ( about 6 thousand people).

Word Count: 180

Answers On The Same Topic:

The charts give information about employment in the UK in 1998 and 2012.

The pie charts illustrates the rate of employment of men and women in the UK in the years of 1998 and 2012. It appears that, the majority full-time workers in the United Kingdom are men while the ratio of part-time working males are the least over the given years. Females are thriving almost similarly in […]

The charts give information about employment in the UK in 1998 and 2012.

The pie charts illustrate the distribution of employment among men and women in the UK in 1988 and 2012, with figures given in thousands. Overall, full-time employment accounted for the largest proportion of the workforce in both years, with men consistently making up the biggest share. However, the gap between male and female full-time employment […]

The charts give information about employment in the UK in 1998 and 2012.

The pie charts and table compare the percentage and number of male and female workers in full-time and part-time jobs in the UK in 1988 and 2012. Overall, men in full-time employment accounted for the largest proportion in both years, although this figure fell over the period. In contrast, the share of women in the […]

The charts give information about employment in the UK in 1998 and 2012.

The pie charts presents differences between full and part time for Men and Woman employees in 1988 and 2012. Overall, booth year demonstrated minor changes, where Men full time workers absolutely dominated and experienced lower changes. Similarly, other categories stayed constant. The number of Men who works full time occupied at least half of whole […]

The charts give information about employment in the UK in 1998 and 2012.

The pie charts illustrate the information about men and women working on full time and part time employment in the United Kingdom between 1998 and 2012. Overall, men in full-time employment accounted for the largest proportion in both years, although this figure fell over the period. In contrast, the share of women in the workforce […]

See All

Other Topics:

The chart below gives information about the level of education in Glasgow, a city in Scotland, in 2010.

The figure illustrates the changes in annual spending by a particular UK school in different time frame. In general, it can be seen that other workers’ salaries has been decresing thoroughly, where as inusrance is opposite of it. In a same way teachers salary and resources books are flowing in a same ratio with up […]

Pie chart: The chart shows the reasons why people moved from one part of Vietnam to live in another. Summarise the information by selecting and reporting the main feathers, and make comparisons where relevant. Here are the data for each reasons why Vietnamese people moved internally in 2012 (in percentages). Employment (54.5%); Study (11.4%); Marriage (21%); Others (13.1%)

The pie chart illustrates the reason why peple in vietnam relocated internally in the year 2012 measured (in percentages) Employment, study, marraige and others this shows why they went from onr to another to live. Overall, the employment was the main reason people moved within vietnam it has a decreasing trend study accounted for the […]

The chart below shows the reasons why students in different age categories voted for a particular candidate to be their student representative. Summarise the information by selecting and reporting the main features, and make comparisons where relevant.

The two pie charts compare the proportion of various reasons why classmates from different age group vote for an aspirant to be their student leader. Overall, It is evident that the most noticeable feature reproducing the answer “easy to talk to”, accounting for the most substantial share of group aged from 18 to 22 in […]

The graphs show figures relating to hours worked and stress levels amongst professionals in eight groups. Summarise the information by selecting and reporting the main features, and make comparisons where relevant.

The graphs illustrates figures relating to hours worked and stress rates among professionals in eight groups namely(writers, doctors, chefs, lecturers, lawyers, movie producers, programmers and business men). Overall, in terms of bar chart, there were upward trends in the business men and movie producers, whereas as for pie chart, the upward trends were lecturers and […]

The pie chart below illustrates how Internet users aged 16+ prefer to access the internet at home and in other places. Summarize the information in the pie chart by selecting and reporting the main feature

The given pie chart depicts how adults choose the way to connect to the internet at home and in different places. Overall, the most used method to access the internet was by a smartphone and a laptop, while the usage of the other ways to connect this was the smallest proportion. In addition, smartphones are […]

See All
We have detected unusual activity on your device.
Please verify your identity to continue.
Note: This verification step won't sign you in. If you have a premium account, please log in to access the service as usual.
Google/Gmail Verification
Or verify using Email/Code
We've sent a verification code to:
youremail@gmail.com (Not your email?)
Enter it below to complete the verification process.
Ensure your email address is correct, your inbox is not full, and you check your spam folder. If no email arrives, consider using an alternative email.
You will need a Premium plan to perform your action!
Note: If you already have a premium account, please log in to access our services as usual.

Plans & Pricing

Our mission is to make quality education accessible for everyone.
However, to keep our hardworking team running and this service alive, we genuinely need your support!
By opting for a premium plan, not only do you sustain us in achieving the mission, but you also unlock advanced features to enrich your learning experience.

Free

For learners who aren't pressed for time

What's included on Free
100+ Cambridge IELTS Tests
Instant IELTS Writing Task 1 & 2 Evaluation (2 times/month)
Instant IELTS Speaking Part 1, 2, & 3 Evaluation (2 times/month)
Instant IELTS Writing Task 1 & 2 Essay Generator (2 times/month)
500+ Dictation & Shadowing Exercises
100+ Pronunciation Exercises
Flashcards
Other Advanced Tools

Premium

For those serious about advancing their English proficiency, and for IELTS candidates aspiring to boost their band score by 1-2 points (especially in writing & speaking) in just 30 days or less

What's included on Premium
Save Your IELTS Test Progress & Analyze Mistakes By Question Type
Save Your Own Flashcard Sets & Use Them On Any Device
Unlock All Courses, IELTS Tests, Section & Part Practice
Unlimited AI Conversations
Unlimited AI Writing Enhancement Exercises
Unlimited IELTS Writing Task 1 & 2 Evaluation
Unlimited IELTS Speaking Part 1, 2, & 3 Evaluation
Checked Answers Will Not Be Published
Unlimited IELTS Writing Task 1 & 2 Essay Generator
Unlimited IELTS Speaking Part 1, 2, & 3 Sample Generator
Unlimited Usage Of Advanced Tools & AI Features
Priority Support within 24h (12-month plan only)

Due to the nature of our service and the provided free trials, payments are non-refundable.