🔥 Today Only: Save 30% on Premium — Offer Ends Soon! - Upgrade Now!
Bar Chart

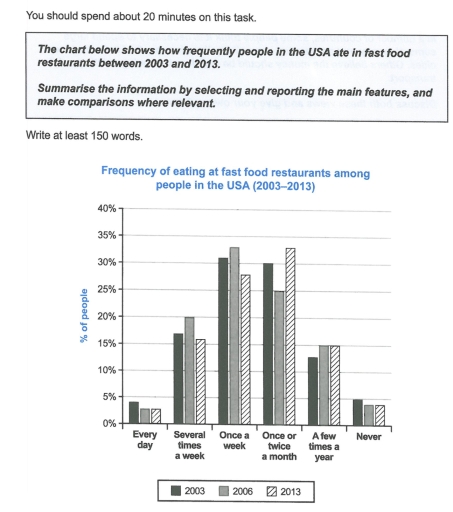
Band 4+: the frequency of people in the US ate in fast food restaurants from 2003 to 1013

Image for topic: the frequency of people in the US ate in fast food restaurants from 2003 to 1013
Our system will evaluate the answer based on this AI-generated description.
The image displays a bar chart depicting the frequency of eating at fast food restaurants among people in the USA from 2003 to 2013. For 2003, the percentage of people eating fast food every day was below 5%; several times a week was approximately 15%; once a week was just over 20%; once or twice a month was approximately 33%; a few times a year was just over 15%; and never was approximately 10%. For 2006, the percentage of people eating fast food every day was around 7%; several times a week was about 17%; once a week was approximately 25%; once or twice a month was just below 30%; a few times a year was about 15%; and never was just below 5%. For 2013, the percentage of people eating fast food every day was approximately 3%; several times a week was about 15%; once a week was just over 30%; once or twice a month was just below 30%; a few times a year was about 15%; and never was just over 5%.
Given the complexity of the image, the above description may not be entirely accurate.
Note: Both the topic and the answer were created by one of our users.

The drawing beneath displays how often people ate in resturant in USA during the period of 2003, 2006 and 2013.

It is noticed that within the period of 2003, 2006 and 2013, there was a record of frequent patronisation of usa resturant, which data indicate that 2006 and 2013 got the highest frequent percentage of people that comes to eat in the resturant.

From 2003, 2006 and 2013 it is observerd that 2006 and 2013 got the highest frequent patronisation by almost 35% of people often coming in the resturant to eat, once in a week and twice in a moth. It is also notice that despite the fact that year 2006 and 2013 got the overall highest % patronisation it also got the overall lowest patronisation on everday by below 5% of people coming to eat.

wile year 2003 got second overrall lowest percentage of people who comes in to eat by almost 5% on every day, and exact 5% on never, a little more than 30% once in a week, while exactly 30% on once or twice in a moth.

Word Count: 182

Answers On The Same Topic:

the frequency of people in the US ate in fast food restaurants from 2003 to 1013

The bar chart illustrates the percentage of individuals who consumed fast food in the USA between 2003 and 2013. Overall, it is apparent that a significant proportion of people consumed fast food either once a week or twice a month, while an insignificant number of citizens ate junk food regular. The intake of fast food […]

the frequency of people in the US ate in fast food restaurants from 2003 to 1013

The bar chart compares how often people in the USA ate at fast-food restaurants in 2003, 2006, and 2013. Overall, eating fast food once a week and once or twice a month were the two most common habits throughout the period. While the largest proportion of Americans ate fast food once a week in 2003 […]

the frequency of people in the US ate in fast food restaurants from 2003 to 1013

The bar chart illustrates the frequency of people ate in fast food restaurants in the USA between 2003 and 2013. Overall, most of the Americans initially ate at fast food restaurants once a week; however, it eventually shifted to be once or twice a month. Both ‘every day’ and ‘never’ categories remained the smallest proportions […]

the frequency of people in the US ate in fast food restaurants from 2003 to 1013

The bar chart illustrates the frequency of Americans eating in fast food restaurants in 2003, 2006, and 2013. Overall, people eating in fast food restaurants once a week initially recorded the highest proportion; however, the habit eventually had shifted to be once or twice a month. By contrast, both every day and never categories showed […]

See All

Other Topics:

the graph shows the sales of five types items in four different seasons at a departmental store in the us in 2011

The bar chart below shares the sales of five kinds of objects in all of the seasons at a departmental shop in the US in 21 century. Overall, in the bar there are 5 various kinds of clothing items, but women’s clothes dominated all of the seasons and illustrated always record degree. As can be […]

The chart shows the division of household tasks bu gender in Great Britain. Write a report for a university lecturer describing the information shown below.

The provided chart demonstrates the division of household activities in males and females in Great Britain, measured in minutes per person per day. Overall, the percentage of females in mostly household tasks is higher than that of males, with the exception of gardening, pet care and maintenance odd jobs throughout the period. Regarding the household […]

The graph shows the amount of paper production by three companies in thousands of tones.

The bar chart illustrates the amount of paper manufactured by three companies in thousands of tones over a period of five years. Overall, it can be clearly seen that the production of paper in company X fluctuated all through while that of company Y and Z either increased or remained constant over the five year […]

The charts below show the percentage of male and female students of different age groups who studied in Australia for full-time and part-time education in 2006. Summarise the information by selecting and reporting the main features, and make comparisons where relevant.

The bar charts compare the data of male and female students across four age groups who participated in two types of education, namely full-time and part-time in 2006. Overall, it is clear that part-time education was more prevalent than full-time study among both males and females in most age groups. In addition, students who were […]

The chart below shows the percentage of men and women who did various free-time activities in England.

The bar chart compares the percentages of men and women who did various free time activities, namely watching TV, spending time with family, shopping, reading, exercise, using the internet and playing computer games in England in 2006. It is clear that the highest percentage of men and women spent their time on watching TV, while […]

See All
We have detected unusual activity on your device.
Please verify your identity to continue.
Note: This verification step won't sign you in. If you have a premium account, please log in to access the service as usual.
Google/Gmail Verification
Or verify using Email/Code
We've sent a verification code to:
youremail@gmail.com (Not your email?)
Enter it below to complete the verification process.
Ensure your email address is correct, your inbox is not full, and you check your spam folder. If no email arrives, consider using an alternative email.
You will need a Premium plan to perform your action!
Note: If you already have a premium account, please log in to access our services as usual.

Plans & Pricing

Our mission is to make quality education accessible for everyone.
However, to keep our hardworking team running and this service alive, we genuinely need your support!
By opting for a premium plan, not only do you sustain us in achieving the mission, but you also unlock advanced features to enrich your learning experience.

Free

For learners who aren't pressed for time

What's included on Free
100+ Cambridge IELTS Tests
Instant IELTS Writing Task 1 & 2 Evaluation (2 times/month)
Instant IELTS Speaking Part 1, 2, & 3 Evaluation (2 times/month)
Instant IELTS Writing Task 1 & 2 Essay Generator (2 times/month)
500+ Dictation & Shadowing Exercises
100+ Pronunciation Exercises
Flashcards
Other Advanced Tools

Premium

For those serious about advancing their English proficiency, and for IELTS candidates aspiring to boost their band score by 1-2 points (especially in writing & speaking) in just 30 days or less

What's included on Premium
Save Your IELTS Test Progress & Analyze Mistakes By Question Type
Save Your Own Flashcard Sets & Use Them On Any Device
Unlock All Courses, IELTS Tests, Section & Part Practice
Unlimited AI Conversations
Unlimited AI Writing Enhancement Exercises
Unlimited IELTS Writing Task 1 & 2 Evaluation
Unlimited IELTS Speaking Part 1, 2, & 3 Evaluation
Checked Answers Will Not Be Published
Unlimited IELTS Writing Task 1 & 2 Essay Generator
Unlimited IELTS Speaking Part 1, 2, & 3 Sample Generator
Unlimited Usage Of Advanced Tools & AI Features
Priority Support within 24h (12-month plan only)

Due to the nature of our service and the provided free trials, payments are non-refundable.