Our system will evaluate the answer based on this AI-generated description.
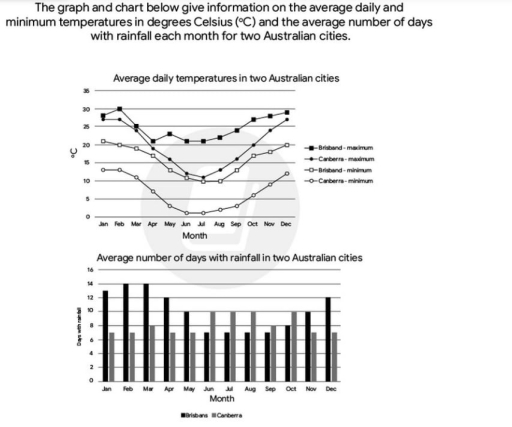
The image includes two graphs for two Australian cities: average daily temperatures and average number of days with rainfall per month. Jan: max (B 30, C 27), min (B 20, C 13), rainfall days (B 14, C 7); Feb: max (B 30, C 26), min (B 20, C 13), rainfall days (B 14, C 8); Mar: max (B 28, C 23), min (B 18, C 11), rainfall days (B 13, C 9); Apr: max (B 27, C 20), min (B 16, C 8), rainfall days (B 10, C 7); May: max (B 24, C 17), min (B 13, C 5), rainfall days (B 9, C 9); Jun: max (B 22, C 13), min (B 11, C 2), rainfall days (B 8, C 9); Jul: max (B 21, C 13), min (B 10, C 1), rainfall days (B 7, C 8); Aug: max (B 23, C 15), min (B 12, C 2), rainfall days (B 6, C 7); Sep: max (B 26, C 18), min (B 15, C 4), rainfall days (B 7, C 8); Oct: max (B 27, C 21), min (B 17, C 7), rainfall days (B 9, C 9); Nov: max (B 28, C 23), min (B 18, C 9), rainfall days (B 10, C 9); Dec: max (B 29, C 26), min (B 19, C 11), rainfall days (B 13, C 9).
Given the complexity of the image, the above description may not be entirely accurate.
Skyrocket your IELTS band score by 1-2 points in under a month with our premium plan!
Note: Both the topic and the answer were created by one of our users.
The provided illustrations display the average daily temperatures in two Australian cities, along with the average number of rainy days per month .
Overall, it is evident that both the maximum and minimum temperatures in Brisbane are higher than those in Canberra. Additionally, there is a similar trend in the average temperatures in both cites, howerver, from April to December, the number of rainy days fluctuates significantly, showing a contrasting pattern.
When it comes to that Brisbane, the mean daily temperature peaks in February at 30°C, whereas 10°C in the June and July was noted as the coldest in this city. Additionally, the average daily maximum temperature in Canberra falls at the beginning and the end of the year at around 27°C compared to the lowest point (1°C) in July.
Meanwhile, the highest average number of rainy days in Brisbane falls between December and April, which has a number of months such as The Febulary and March over 13°C
Word Count: 159
