🔥 Today Only: Save 30% on Premium — Offer Ends Soon! - Upgrade Now!
Line Graph

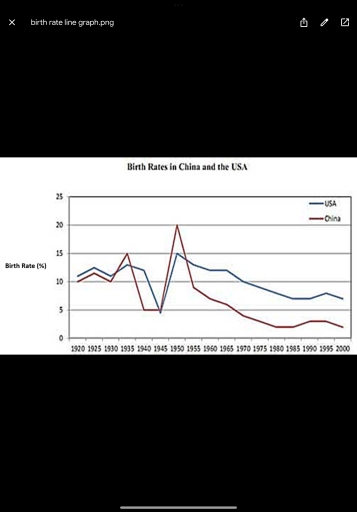
Band 7+: The graph below compares the changes in the birth rates of China and the USA between 1920 and 2000. Summarise the information by selecting and reporting the main features and make comparisons where relevant.

Image for topic: The graph below compares the changes in the birth rates of China and the USA between 1920 and 2000. Summarise the information by selecting and reporting the main features and make comparisons where relevant.
Our system will evaluate the answer based on this AI-generated description.
The image presents a line graph comparing birth rates in China and the USA from 1920 to 2000. In 1920, China’s birth rate is 9 while the USA's is slightly higher at 11.5, with 1925 showing China at 14 and USA at 14.5. The 1930 data indicates China at 13 and USA at 15, then 1935 records China at 12 and USA at 13. A mark of 15 for China and 12 for USA in 1940 precedes an increase to 20 in 1945 for China and 17 for USA. Both rates peak in 1950, at 22 for China and 20 for USA, before declining, hitting 17 for China and 19 for USA in 1955. China then descends sharply to 7 in 1960, and 6 in 1965, whereas the USA's gradual decrease sets it at 18 in 1960 and 14 in 1965. By 1970, China is at 5, with USA at 15; in 1975, China remains at 5, and USA is at 14. In 1980, both countries stand at 10, China remains at 4 in 1985 and USA adjusts to 13. By 1990, China reaches 4, and USA is at 12; by 1995, China’s birth rate is at 5 contrasted by USA’s 13. The final year, 2000, marks stable rates with China at 7 and USA at 12.
Given the complexity of the image, the above description may not be entirely accurate.
Note: Both the topic and the answer were created by one of our users.

The given line graph presents a comparison of birth rates in China and USA from 1920 to 2000.

Overall, the graph reveals distinct patterns in birth rates for both countries, whereas, the USA faced a generally gradual decline, while China experienced significant fluctuations, including a sharp spike in the mid-20th century.

In the United States of America, birth rates remained relatively stable between 1920 and 1940, hovering around 15 births per 100 people. A slight decrease occured in the following decade, reaching a low point of approximately 5 births per 100 people in 1945. Subsequently, the birth rates rebounded to its highest point of 20 births per 100 people in 1950 before gradually declined to roughly 3 births per 100 people by the end of the period.

On the other hand, China’s birth rate faced a dramatical fluctuation throughout the period. After a modest increase from 1920 to 1935, reaching 15 births per 100 people, it experienced a steep decline to around 5 births in the following five years. Following this drop, birth rates withness a dramatic surge in the late 1950s and early 1960s, peaking at over 20 births per 100 people. This spike was followed by a dramatic decline over the next 5 years, also, by 2000 China’s birth rate had fallen dramatically to as-low-as 2 births per 100 people.

Word Count: 222

Answers On The Same Topic:

The graph below compares the changes in the birth rates of China and the USA between 1920 and 2000. Summarise the information by selecting and reporting the main features and make comparisons where relevant.

the given line graph illustrates amount of birth rates in China and USA between 1920 and 2000. overall, China had significant flactuations over the period and felt down by the end. The USA had not as flactuations as China, however had noteable decrease by the end. Additionally, both country were an identical level in the […]

The graph below compares the changes in the birth rates of China and the USA between 1920 and 2000. Summarise the information by selecting and reporting the main features and make comparisons where relevant.

The graph below compares the changes in the birth rates of China and the USA between 1920 and 2000. Overall, the data reveals a similar trajectory in birth rate both in China and the USA, with the USA commences a higher level than China, yet maintained its higher position in the final examined year. The […]

The graph below compares the changes in the birth rates of China and the USA between 1920 and 2000. Summarise the information by selecting and reporting the main features and make comparisons where relevant.

A glance at the graph provided reveals how the fertility rates in America and China altered over an 80-year period from 1920 to 2000. Overall, both countries witnessed a dramatic fall during 1940-1945, with a notable increase between around 1945-1955 before leveling off. Increasing from approximately 10% to 15% in 1935, the birth rate in […]

The graph below compares the changes in the birth rates of China and the USA between 1920 and 2000. Summarise the information by selecting and reporting the main features and make comparisons where relevant.

A glance at the graph provided reveals how the fertility rates in America and China altered over a 80-year period from 1920 to 2000. Overall, both countries witnessed dramatical fall during 1940-1945, with notable increase between around 1945-1955 before leveling off. Increasing from approximately 10 % to 15 % in 1935, the birth rate in […]

See All

Other Topics:

You should spend about 20 minutes on this task. The graph below gives information on the numbers of participants for different activities at one social centre in Melbourne, Australia for the period 2000 to 2020. Summarise the information by selecting and reporting the main features, and make comparisons where relevant. Write at least 150 words.

The provided diagram illustrates the numbers of participants for five different activities (film club, martial arts, amateur dramatics, table tennis and musical performances) at a particular social center between 2000 and 2020 in Melbourne, Australia. Overall, table tennis and musical performance witnessed a significant growth throughout the years, whereas amateur dramatics experienced a dramatic decline. […]

Task 1: The graph below compares SAT math results according to gender from 1992 to 2000 in a particular school.

The line graph compares student’s performance on SAT math scores in points between 1992 to 2000 according to their gender. Overall , male students achieved higher math scores in the given years, whereas, female students shows a notebly increased throughout the years. In 1992, male test takers starting off strong by scoring on average of […]

Write an essay based on the graph above. You should write not less than 150 words

The line graph provides the information about trends in the consumption of strawberry, lemon and cherry jams in Asia from 1991 to 2014. Overall, while strawberry jam saw drammatic decline, the vice verse is true for cherry. However, the more fluctuations were observed at lemon jam’s during the period. Notably, eventhough the share of cherry […]

The line chart shows attandance at the cinema among various age groups in the US form 2000 to 2011

The graph depicts information about attendance at the cinema among groups with the age variety in the US, over elevem-year period between 2000 to 2011. Overall, what stands out from the graph is that there were upward trends in the percentage of all the groups, but the percentage of group with 15 to 24 years […]

The line graph below illustrates monthly sales in a local coffee shop over a five-month period. Summarize the information by selecting and reporting the main features, and make comparisons where relevant.

The graph line demonstrates key data about the sales in a local coffee shop over five months(january,february,march,april,may) ,measured by units. Overall,from the graph given it is evident that the sales witnessed a dramatical surge in the earnings of the café .Whereas ,from the period of march to april the graph line highlihted a constant rise. […]

See All
We have detected unusual activity on your device.
Please verify your identity to continue.
Note: This verification step won't sign you in. If you have a premium account, please log in to access the service as usual.
Google/Gmail Verification
Or verify using Email/Code
We've sent a verification code to:
youremail@gmail.com (Not your email?)
Enter it below to complete the verification process.
Ensure your email address is correct, your inbox is not full, and you check your spam folder. If no email arrives, consider using an alternative email.
You will need a Premium plan to perform your action!
Note: If you already have a premium account, please log in to access our services as usual.

Plans & Pricing

Our mission is to make quality education accessible for everyone.
However, to keep our hardworking team running and this service alive, we genuinely need your support!
By opting for a premium plan, not only do you sustain us in achieving the mission, but you also unlock advanced features to enrich your learning experience.

Free

For learners who aren't pressed for time

What's included on Free
100+ Cambridge IELTS Tests
Instant IELTS Writing Task 1 & 2 Evaluation (2 times/month)
Instant IELTS Speaking Part 1, 2, & 3 Evaluation (2 times/month)
Instant IELTS Writing Task 1 & 2 Essay Generator (2 times/month)
500+ Dictation & Shadowing Exercises
100+ Pronunciation Exercises
Flashcards
Other Advanced Tools

Premium

For those serious about advancing their English proficiency, and for IELTS candidates aspiring to boost their band score by 1-2 points (especially in writing & speaking) in just 30 days or less

What's included on Premium
Save Your IELTS Test Progress & Analyze Mistakes By Question Type
Save Your Own Flashcard Sets & Use Them On Any Device
Unlock All Courses, IELTS Tests, Section & Part Practice
Unlimited AI Conversations
Unlimited AI Writing Enhancement Exercises
Unlimited IELTS Writing Task 1 & 2 Evaluation
Unlimited IELTS Speaking Part 1, 2, & 3 Evaluation
Checked Answers Will Not Be Published
Unlimited IELTS Writing Task 1 & 2 Essay Generator
Unlimited IELTS Speaking Part 1, 2, & 3 Sample Generator
Unlimited Usage Of Advanced Tools & AI Features
Priority Support within 24h (12-month plan only)

Due to the nature of our service and the provided free trials, payments are non-refundable.