Our system will evaluate the answer based on this AI-generated description.
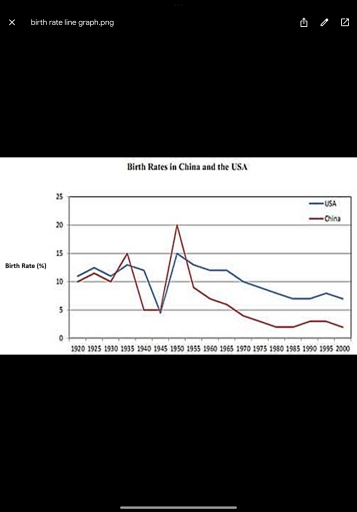
The image presents a line graph comparing birth rates in China and the USA from 1920 to 2000. In 1920, China’s birth rate is 9 while the USA's is slightly higher at 11.5, with 1925 showing China at 14 and USA at 14.5. The 1930 data indicates China at 13 and USA at 15, then 1935 records China at 12 and USA at 13. A mark of 15 for China and 12 for USA in 1940 precedes an increase to 20 in 1945 for China and 17 for USA. Both rates peak in 1950, at 22 for China and 20 for USA, before declining, hitting 17 for China and 19 for USA in 1955. China then descends sharply to 7 in 1960, and 6 in 1965, whereas the USA's gradual decrease sets it at 18 in 1960 and 14 in 1965. By 1970, China is at 5, with USA at 15; in 1975, China remains at 5, and USA is at 14. In 1980, both countries stand at 10, China remains at 4 in 1985 and USA adjusts to 13. By 1990, China reaches 4, and USA is at 12; by 1995, China’s birth rate is at 5 contrasted by USA’s 13. The final year, 2000, marks stable rates with China at 7 and USA at 12.
Given the complexity of the image, the above description may not be entirely accurate.
Skyrocket your IELTS band score by 1-2 points in under a month with our premium plan!
Note: Both the topic and the answer were created by one of our users.
The graph below compares the changes in the birth rates of China and the USA between 1920 and 2000.
Overall, the data reveals a similar trajectory in birth rate both in China and the USA, with the USA commences a higher level than China, yet maintained its higher position in the final examined year.
The USA started at 11% birth rate in 1920, the subsequent volatile was occurred during 1925 to 1955. Notably, it reached a peak of 20% birth rate, reflecting an enhancement in the principle of having kid. After peaking, the percentage of birth rate showed a steady downcast trend, reducing to just 6% in the end year.
Similarly to the USA, China displayed a mirrored trend in birth rate observation, starting from exactly 10% birth rate in 1990 in prior fluctuating during 1925 to 1955, indicating the same preference with the USA in family future plan. The birth rate culminated at 15%, the rate continued gradually decline to merely 3% by the year 2000.
Word Count: 167
