🔥 Today Only: Save 30% on Premium — Offer Ends Soon! - Upgrade Now!
Line Graph

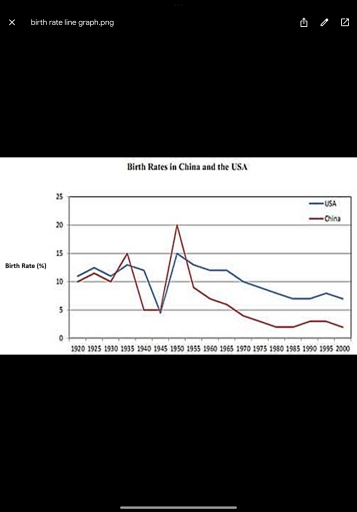
Band 6+: The graph below compares the changes in the birth rates of China and the USA between 1920 and 2000. Summarise the information by selecting and reporting the main features and make comparisons where relevant.

Image for topic: The graph below compares the changes in the birth rates of China and the USA between 1920 and 2000. Summarise the information by selecting and reporting the main features and make comparisons where relevant.
Our system will evaluate the answer based on this AI-generated description.
The image presents a line graph comparing birth rates in China and the USA from 1920 to 2000. In 1920, China’s birth rate is 9 while the USA's is slightly higher at 11.5, with 1925 showing China at 14 and USA at 14.5. The 1930 data indicates China at 13 and USA at 15, then 1935 records China at 12 and USA at 13. A mark of 15 for China and 12 for USA in 1940 precedes an increase to 20 in 1945 for China and 17 for USA. Both rates peak in 1950, at 22 for China and 20 for USA, before declining, hitting 17 for China and 19 for USA in 1955. China then descends sharply to 7 in 1960, and 6 in 1965, whereas the USA's gradual decrease sets it at 18 in 1960 and 14 in 1965. By 1970, China is at 5, with USA at 15; in 1975, China remains at 5, and USA is at 14. In 1980, both countries stand at 10, China remains at 4 in 1985 and USA adjusts to 13. By 1990, China reaches 4, and USA is at 12; by 1995, China’s birth rate is at 5 contrasted by USA’s 13. The final year, 2000, marks stable rates with China at 7 and USA at 12.
Given the complexity of the image, the above description may not be entirely accurate.
Note: Both the topic and the answer were created by one of our users.

A glance at the graph provided reveals how the fertility rates in America and China altered over a 80-year period from 1920 to 2000. Overall, both countries witnessed dramatical fall during 1940-1945, with notable increase between around 1945-1955 before leveling off.

Increasing from approximately 10 % to 15 % in 1935, the birth rate in China plunged to a low of 5% in the next 5 years. This was followed by a dramatical surge, with the birth rate quadrupling to reach its peak at 20 % in 1950.Thereafter, the figure declined consistently, finishing century at below 3% the lowest shown.

The natality in USA, meanwhile being unstable somewhere between 11% an 13% before dropping sharply to less than 5% in 1945. The following five years showed a rapid climb in this rate to somewhere in the vicinity of 15%. Additionally, unlike China, however, the US fertility rate experienced steady fluctuation therefore toward the end of the period.

In summary, the fact that while the birth rate of both countries were comparable up to 1950, a huge gap has appeared after this time as the fertility in China slowly slid away.

Word Count: 190

Answers On The Same Topic:

The graph below compares the changes in the birth rates of China and the USA between 1920 and 2000. Summarise the information by selecting and reporting the main features and make comparisons where relevant.

The graph below compares the changes in the birth rates of China and the USA between 1920 and 2000. Overall, the data reveals a similar trajectory in birth rate both in China and the USA, with the USA commences a higher level than China, yet maintained its higher position in the final examined year. The […]

The graph below compares the changes in the birth rates of China and the USA between 1920 and 2000. Summarise the information by selecting and reporting the main features and make comparisons where relevant.

A glance at the graph provided reveals how the fertility rates in America and China altered over an 80-year period from 1920 to 2000. Overall, both countries witnessed a dramatic fall during 1940-1945, with a notable increase between around 1945-1955 before leveling off. Increasing from approximately 10% to 15% in 1935, the birth rate in […]

The graph below compares the changes in the birth rates of China and the USA between 1920 and 2000. Summarise the information by selecting and reporting the main features and make comparisons where relevant.

A glance at the graph provided reveals how the fertility rates in America and China altered over a 80-year period from 1920 to 2000. Overall, both nations witnessed marked fluctuation, with notable troughs in the 1940s and peaks in the 1950s. Birth rates in USA and China was broadly comparble up to mid century prior […]

The graph below compares the changes in the birth rates of China and the USA between 1920 and 2000. Summarise the information by selecting and reporting the main features and make comparisons where relevant.

The line graph compares the birth rate proportions in China and the USA over eighty years, from 1920 to 2000. Overall, despite a sharp increase in the 1950s, the proportions of birth rates both in China and the USA decreased significantly over the examined period. Notably, while the birth rate difference between the two nations […]

See All

Other Topics:

Cinema visits for all age groups. Summarize the information by selecting and reporting the main features, and make comparisons where relevant.

The graph illustrates cinema attendance trends in the UK between 1994 and 2002 across various age brackets. Overall, younger individuals visited cinemas far more frequently than their older counterparts. Although the proportion of the population attending screenings was relatively consistent throughout the period, the average number of annual visits experienced notable fluctuations. In 1994, 67% […]

Cinema visits for all age groups. Summarize the information by selecting and reporting the main features, and make comparisons where relevant.

The graph illustrates cinema-going patterns in the UK between 1994 and 2002 across different age groups. Overall, younger individuals were considerably more likely to go to the cinema, whereas older people showed lower levels of participation. While the proportion of people attending cinemas remained relatively stable, the frequency of trips fluctuated noticeably throughout the period. […]

The line graph below shows the average number of visitors entering a museum in the UK during summer and winter in 2023. Summarize the information by selecting and reporting the main features and makecomparisons where relevant. Write at least 150 words.

The line graph above demonstrates the average visitor count of a museum in the UK for the summer and winter seasons in 2023. Overall, it is quite clear that people tend to visit the museum more in the summer rather than in the winter. Additionally, although the opening hours are the same in both seasons, […]

The line graph below shows the average number of visitors entering a museum in the UK during summer and winter in 2023. Summarize the information by selecting and reporting the main features and makecomparisons where relevant. Write at least 150 words.

The line graph above demonstrates the average visitor count of a museum in the UK for the seasons summer and winter in 2023. Overall, it is quite clear that people are more tend to visit the museum in the summer rather than in the winter. Additionally, although in both of the seasons the opening hour […]

The graph below shows average carbon dioxide (CO₂) emissions per person in Ireland, Sweden, France, and Spain between 1970 and 2010. Summarise the information by selecting and reporting the main features, and make comparisons where relevant.

The line graph compares the data about the CO2 emissions per individual in four different countries from 1975 to 2015. It is clear that the highest amount of CO2 was emitted by per individuals in France, while the amount of CO2 per person in Greece was the least other the given period. Looking at the […]

The graph below shows the number of enquiries received by a University Admission Office over a six-month period in 2021.

The line chart illustrates how the number of applicants apply in University Admissions Office evolved between January and June in 2021, with projections provided for a half year. Overall, fore and foremost gradually increased applicants by in person, while job applicants by letter/email were decreased slowly, and followed by applicant by telephone fluctuated from January […]

See All
We have detected unusual activity on your device.
Please verify your identity to continue.
Note: This verification step won't sign you in. If you have a premium account, please log in to access the service as usual.
Google/Gmail Verification
Or verify using Email/Code
We've sent a verification code to:
youremail@gmail.com (Not your email?)
Enter it below to complete the verification process.
Ensure your email address is correct, your inbox is not full, and you check your spam folder. If no email arrives, consider using an alternative email.
You will need a Premium plan to perform your action!
Note: If you already have a premium account, please log in to access our services as usual.

Plans & Pricing

Our mission is to make quality education accessible for everyone.
However, to keep our hardworking team running and this service alive, we genuinely need your support!
By opting for a premium plan, not only do you sustain us in achieving the mission, but you also unlock advanced features to enrich your learning experience.

Free

For learners who aren't pressed for time

What's included on Free
100+ Cambridge IELTS Tests
Instant IELTS Writing Task 1 & 2 Evaluation (2 times/month)
Instant IELTS Speaking Part 1, 2, & 3 Evaluation (5 times/month)
Instant IELTS Writing Task 1 & 2 Essay Generator (2 times/month)
500+ Dictation & Shadowing Exercises
100+ Pronunciation Exercises
Flashcards
Other Advanced Tools

Premium

For those serious about advancing their English proficiency, and for IELTS candidates aspiring to boost their band score by 1-2 points (especially in writing & speaking) in just 30 days or less

What's included on Premium
Save Your IELTS Test Progress
Unlock All Courses & IELTS Tests
Unlimited AI Conversations
Unlimited AI Writing Enhancement Exercises
Unlimited IELTS Writing Task 1 & 2 Evaluation
Unlimited IELTS Speaking Part 1, 2, & 3 Evaluation
Checked Answers Will Not Be Published
Unlimited IELTS Writing Task 1 & 2 Essay Generator
Unlimited IELTS Speaking Part 1, 2, & 3 Sample Generator
Unlimited Usage Of Advanced Tools
Priority Support within 24h (12-month plan only)

Due to the nature of our service and the provided free trials, payments are non-refundable.
Nếu bạn là người Việt Nam và không có hoặc không muốn trả bằng credit/debit cards, bạn có thể thanh toán bằng phương thức chuyển khoản:


Chọn gói:
419,000₫ 277,000 ₫ cho gói 1 tháng (chỉ 9,233₫/ngày)
1,239,000₫ 597,000 ₫ cho gói 3 tháng (chỉ 6,633₫/ngày)
2,469,000₫ 1,027,000 ₫ cho gói 6 tháng (chỉ 5,706₫/ngày)
4,929,000₫ 1,417,000 ₫ cho gói 12 tháng (chỉ 3,936₫/ngày)


Sau khi chuyển khoản, vui lòng đợi trình duyệt tự động điều hướng bạn trở lại Engnovate và bạn sẽ ngay lập tức nhận được mã kích hoạt tài khoản premium.
Nếu có lỗi xảy ra, bạn có thể liên hệ với team thông qua một trong các phương thức: email đến helloengnovate@gmail.com hoặc nhắn tin qua facebook.com/engnovate.
Vì toàn bộ công cụ trên website đều có thể sử dụng thử miễn phí, Engnovate không hỗ trợ hoàn tiền.