Our system will evaluate the answer based on this AI-generated description.
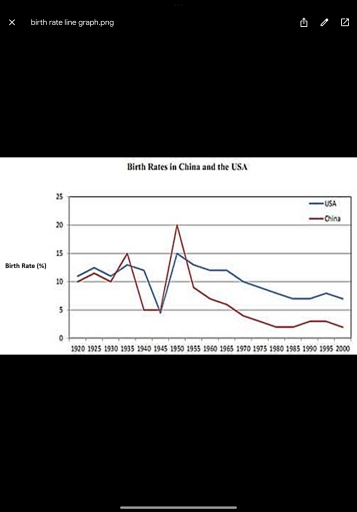
The image presents a line graph comparing birth rates in China and the USA from 1920 to 2000. In 1920, China’s birth rate is 9 while the USA's is slightly higher at 11.5, with 1925 showing China at 14 and USA at 14.5. The 1930 data indicates China at 13 and USA at 15, then 1935 records China at 12 and USA at 13. A mark of 15 for China and 12 for USA in 1940 precedes an increase to 20 in 1945 for China and 17 for USA. Both rates peak in 1950, at 22 for China and 20 for USA, before declining, hitting 17 for China and 19 for USA in 1955. China then descends sharply to 7 in 1960, and 6 in 1965, whereas the USA's gradual decrease sets it at 18 in 1960 and 14 in 1965. By 1970, China is at 5, with USA at 15; in 1975, China remains at 5, and USA is at 14. In 1980, both countries stand at 10, China remains at 4 in 1985 and USA adjusts to 13. By 1990, China reaches 4, and USA is at 12; by 1995, China’s birth rate is at 5 contrasted by USA’s 13. The final year, 2000, marks stable rates with China at 7 and USA at 12.
Given the complexity of the image, the above description may not be entirely accurate.
Skyrocket your IELTS band score by 1-2 points in under a month with our premium plan!
Note: Both the topic and the answer were created by one of our users.
The line graph compares the birth rate proportions in China and the USA over eighty years, from 1920 to 2000.
Overall, despite a sharp increase in the 1950s, the proportions of birth rates both in China and the USA decreased significantly over the examined period. Notably, while the birth rate difference between the two nations was minimal in the beginning, it was greatly pronounced by the end of the period, with the USA reporting higher rates than China.
In the first half of the period, China and the USA experienced pronounced fluctuations in birth rate proportions. In 1920, the birth rate in China and the USA stood at 10% and 12%, respectively. Despite slight fluctuations between 10% and 15% in the next two decades, the figures for both nations dropped dramatically to 5% by 1945. However, over the following decade, both nations reached their peak of 20% for China and 15% for the USA.
In the rest of the period, both nations witnessed declines in their birth rates at different degrees, with the USA maintaining a consistently higher rate. Having reached its peak in 1950, the figures for China dropped considerably, falling to 7% in 1955, whereas that for the USA declined markedly to 12%. By 2000, both China and the USA followed a relatively similar downward trend, finishing the period with respective percentages of 3% and 7%.
Word Count: 228
