Our system will evaluate the answer based on this AI-generated description.
The image is a bar graph depicting coffee production in million tonnes for four countries - Brazil, Colombia, Indonesia, and Vietnam - over four time periods: 1990, 1995, 2000, and 2010. In 1990, Brazil produced 1.2 million tonnes, Colombia produced 0.6 million tonnes, Indonesia produced 0.2 million tonnes, and Vietnam produced 0.1 million tonnes. In 1995, Brazil increased to 1.4 million tonnes, Colombia decreased slightly to 0.5 million tonnes, Indonesia increased to 0.5 million tonnes, and Vietnam increased to 0.2 million tonnes. In 2000, Brazil decreased to 1.0 million tonnes, Colombia remained at 0.5 million tonnes, Indonesia increased to 0.6 million tonnes, and Vietnam saw a significant increase to 0.8 million tonnes. In 2010, Brazil jumped to 1.8 million tonnes, Colombia decreased to 0.4 million tonnes, Indonesia remained at 0.6 million tonnes, and Vietnam saw a substantial increase to 1.6 million tonnes. Brazil consistently had the highest production, while Vietnam saw the most dramatic increase from 1990 to 2010.
Given the complexity of the image, the above description may not be entirely accurate.
Skyrocket your IELTS band score by 1-2 points in under a month with our premium plan!
Note: Both the topic and the answer were created by one of our users.
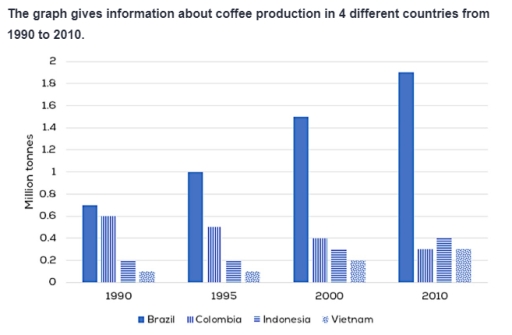
The given graph indicates the amount of coffee produced in four nations, namely Brazil, Colombia, Indonesia and Vietnam over a 30 year period, commencing from 1990.
Overall, Brazil’s coffee production took the lead during the timeframe, compared to the other three mentioned counterparts. In addition, the period given witnessed an upward trend in the coffee output of three nations, except for Columbia throughout.
Regarding two biggest producers, roughly 0.7 million tonnes of coffee were produced in Brazil, higher than that of Columbia by 0.1 million tonnes in the initial year. After 30 years, the gap between these nations became increasingly obvious as the former progressively increased twofold while the latter halved.
Considering the remaining categories, the output of coffee in Indonesia and Vietnam remained unchanged from 1990 to 1995, with 0.2 and 0.1 million tonnes respectively. Then, both experienced a slow decrease in the figure for coffee manufactured, with Indonesia’s amount doubling the initial data and that of Vietnam equal to Columbia’s 2010 datapoint by the end of the period.
Word Count: 170
