🔥 Today Only: Save 30% on Premium — Offer Ends Soon! - Upgrade Now!
Bar Chart

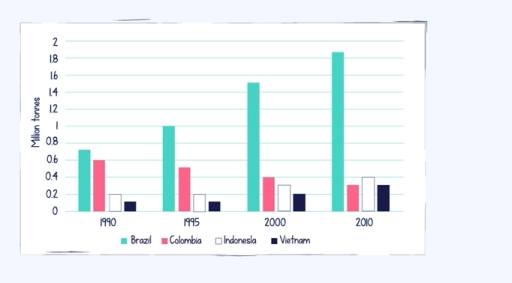
Band 4+: the graph below gives information about coffee production in 4 different countries from 1990 to 2010

Image for topic: the graph below gives information about coffee production in 4 different countries from 1990 to 2010
Our system will evaluate the answer based on this AI-generated description.
The image presents a bar graph comparing coffee production across four years: 1990, 1995, 2000, and 2010, for Brazil, Colombia, Indonesia, and Vietnam measured in million tonnes. In 1990, Brazil produced approximately 8 million tonnes, Colombia about 2.5 million tonnes, Indonesia around 0.8 million tonnes, and Vietnam roughly 0.2 million tonnes; in 1995, Brazil's production was approximately 11 million tonnes, Colombia's remained at 2.5 million tonnes, Indonesia stayed at 0.8 million tonnes, and Vietnam's increased slightly to 0.3 million tonnes. In 2000, Brazil reached roughly 14 million tonnes, Colombia decreased slightly to 2 million tonnes, Indonesia remained at 0.8 million tonnes, and Vietnam rose significantly to 0.9 million tonnes. By 2010, Brazil's production was about 18.5 million tonnes, Colombia's dropped to just below 2 million tonnes, Indonesia maintained about 0.8 million tonnes, and Vietnam's production sharply increased to almost 2 million tonnes.
Given the complexity of the image, the above description may not be entirely accurate.
Note: Both the topic and the answer were created by one of our users.

This data illustrate facts about 4 regions that the coffee production in it in 1990 and 2010 .

Over all, the most noticeable feature is Brazil being number 1 around the years in coffee production and Colombia being steadily decreased in the same years.

First of all, as we can see in 1990 there was no big difference between them especially between Brazil and Colombia cuz the first one got around 0.7 tonne and the last got 0.6 tonne . Secondly, in 1995 the amount of coffee Brazil produced clearly has been increased. On the other hand, Colombia production has dropped to around 0.5 tonne.

Also, in 1995 and 2000 Brazil production significantly increased from 1 to around 15 tonnes in five years and this the clearest growth in the data.

Finally, in 2010 Brazil become the highest country that produces the most tons of coffee who reached around 19 tonnes in 20 years.

Word Count: 154

Answers On The Same Topic:

the graph below gives information about coffee production in 4 different countries from 1990 to 2010

The bar chart compares four countries (Brazil, Colombia, Indonesia and Vietnam) in terms of their coffee production between 1990 and 2010. Looking from an overall perspective, it is noticeable that Brazil witnessed a consistent climb, whereas other countries exhibited fluctuating trend in production relative to their initial output. Upon closer look, in 1990 Brazil led […]

the graph below gives information about coffee production in 4 different countries from 1990 to 2010

The bar chart below demonstrates data about coffee production in Brazil, Colombia, Indonesia, and Vietnam from 1990 to 2010. Overall,Brazil hasthe highest rank , while Vietnam has the lowest rank. Coffee production in Colombia decreased over the period given, while in Vietnam. At the beginning, in 1990, Brazil had the highest rank, accounting for more […]

the graph below gives information about coffee production in 4 different countries from 1990 to 2010

The bar chart shows how much coffee were produced in four countries ( Brazil, Colombia, Indonesia and Vietnam) from 1990 to 2010. Overall, the production of coffee in Brazil had the most significant increase among the four countries. While, other countries produced coffee more and more Colombia saw a drop in its productoin. In the […]

the graph below gives information about coffee production in 4 different countries from 1990 to 2010

The bar graph illustrates the coffee production levels in four countries—Brazil, Colombia, Indonesia, and Vietnam—over the two-decade period from 1990 to 2010. Overall, Brazil consistently emerged as the dominant coffee producer throughout the recorded years, while Vietnam exhibited the most significant growth in production relative to its initial output. In 1990, Brazil led coffee production […]

See All

Other Topics:

The bar chart below shows information regarding the change in the percentage of the population aged 65 and above in three countries. Summarize the information by selecting and reporting the main features and make comparisons where relevant.

The chart illustrates in the population aged 65 over in UK,Germany,Canada between 1980 and 2030 this graph shows the future plan. Overall,all line shows from the beginning.The chart a steady rise and the graph will continue the future.In future the Germany will be the highest. In 1980,the Canada was 10% after 20 year rose 15%.In […]

Percentage of students proficient in a foreign language. Summarise the information by selecting and reporting the main features, and make comparison where relevant.

The bar chart illustrates the proportion of households that had internet access in four countries, namely the UK, France, Japan and Brazil, over a 15-year period from 2005 to 2020. Overall, internet access increased in all four countries during this period, although the extent of growth varied considerably, with Brazil showing the most dramatic rise […]

the graph below shows female unemployment rates in each country of the United Kingdom in 2013 and 2014.Summarize the information by selecting and reporting the main features, and make comparisons where relevant.

The provided bar chart compares the percentages of women who were unemployed in the four countries of the United kingdom-England, Wales, Scotland and Northern Ireland-in 2013 and 2014. Overall, feamale unemployement declined in England, Wales and Northern Ireland, whereas Scotland was the only country to experience an increase. England recorded the highest rate in 2013, […]

The chart below shows the average number of annual visitors to five types of cultural venues in London in 2015 and 2019. Summarise the information by selecting and reporting the main features and make comparisons where relevant.

The bar chart illustrates the yearly visitor averages across five categories of cultural facilities in London during the years 2015 and 2019. Overall, the chart shows that majority of cultural venues experienced an increase in popularity, with the sole exception of libraries, which saw a decline in attendance. Additionally, museums remained the most popular destination […]

The bar chart shows the number of visits to a community website in the first and second years of use. Summarise the information by selecting and reporting the main features, and make comparisons where relevant.

The bar chart illustrates the number of visits to a community website during the first and second years. From an overall perspective, the second year of use experienced a significant increase in the middle and later months, while website recorded fewer visits in total in the first year. In addition, the number of visits in […]

The graph below shows information about the activities that New Zealand children enjoy doing the most in 2007.

The bar chart provides information about the different pastime activities that boys and girls preferred. From an overall perspective, the highest percentages of boys enjoyed sports and going to the park, while girls showed a greater preference for art and craft. In addition, the rate of both genders watching DVDs were identical. Taking a closer […]

See All
We have detected unusual activity on your device.
Please verify your identity to continue.
Note: This verification step won't sign you in. If you have a premium account, please log in to access the service as usual.
Google/Gmail Verification
Or verify using Email/Code
We've sent a verification code to:
youremail@gmail.com (Not your email?)
Enter it below to complete the verification process.
Ensure your email address is correct, your inbox is not full, and you check your spam folder. If no email arrives, consider using an alternative email.
You will need a Premium plan to perform your action!
Note: If you already have a premium account, please log in to access our services as usual.

Plans & Pricing

Our mission is to make quality education accessible for everyone.
However, to keep our hardworking team running and this service alive, we genuinely need your support!
By opting for a premium plan, not only do you sustain us in achieving the mission, but you also unlock advanced features to enrich your learning experience.

Free

For learners who aren't pressed for time

What's included on Free
100+ Cambridge IELTS Tests
Instant IELTS Writing Task 1 & 2 Evaluation (2 times/month)
Instant IELTS Speaking Part 1, 2, & 3 Evaluation (2 times/month)
Instant IELTS Writing Task 1 & 2 Essay Generator (2 times/month)
500+ Dictation & Shadowing Exercises
100+ Pronunciation Exercises
Flashcards
Other Advanced Tools

Premium

For those serious about advancing their English proficiency, and for IELTS candidates aspiring to boost their band score by 1-2 points (especially in writing & speaking) in just 30 days or less

What's included on Premium
Save Your IELTS Test Progress & Analyze Mistakes By Question Type
Save Your Own Flashcard Sets & Use Them On Any Device
Unlock All Courses, IELTS Tests, Section & Part Practice
Unlimited AI Conversations
Unlimited AI Writing Enhancement Exercises
Unlimited IELTS Writing Task 1 & 2 Evaluation
Unlimited IELTS Speaking Part 1, 2, & 3 Evaluation
Checked Answers Will Not Be Published
Unlimited IELTS Writing Task 1 & 2 Essay Generator
Unlimited IELTS Speaking Part 1, 2, & 3 Sample Generator
Unlimited Usage Of Advanced Tools & AI Features
Priority Support within 24h (12-month plan only)

Due to the nature of our service and the provided free trials, payments are non-refundable.