Our system will evaluate the answer based on this AI-generated description.
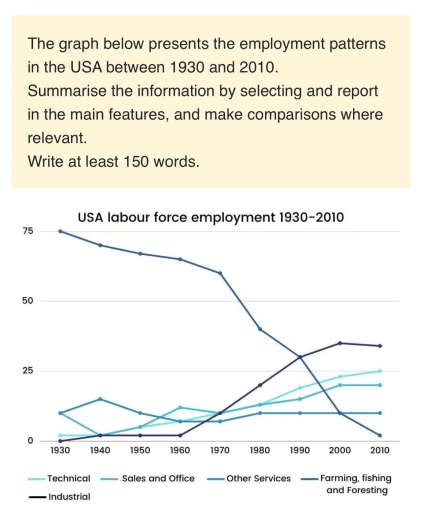
The image depicts USA labor force employment trends from 1930 to 2010 across five categories: Technical, Sales and Office, Other Services, Farming, Fishing, and Forestry, and Industrial. In 1930, Farming, Fishing, and Forestry constituted 75%, Technical approximately 0%, Sales and Office around 10%, Other Services about 10%, and Industrial near 7.5%. By 1940, Technical stayed constant, Sales and Office slightly over 15%, Other Services remained unchanged, Farming, Fishing, and Forestry decreased to approximately 70%, and Industrial rose marginally. In 1950, Technical remained near 0%, Sales and Office approximated 17.5%, Other Services near 10%, Farming, Fishing, and Forestry further dropped to around 60%, and Industrial exceeded 10%. By 1960, Technical remained minimal, Sales and Office rose to about 20%, Other Services over 10%, Farming, Fishing, and Forestry continued its decline to approximately 50%, and Industrial just below 20%. In 1970, Technical showed little change, Sales and Office increased slightly above 22.5%, Other Services grew to nearly 15%, Farming, Fishing, and Forestry close to 40%, and Industrial reached nearly 20%. By 1980, Technical began showing a rise at around 2.5%, Sales and Office reached over 25%, Other Services slightly above 15%, Farming, Fishing, and Forestry decreasing further to around 25%, and Industrial surpassing 20%. In 1990, Technical climbed to about 5%, Sales and Office slightly below 30%, Other Services over 17.5%, Farming, Fishing, and Forestry near 15%, and Industrial just above 22.5%. By 2000, Technical grew to around 12.5%, Sales and Office slightly above 30%, Other Services just over 20%, Farming, Fishing, and Forestry approximately 10%, and Industrial fell to nearly 15%. In 2010, Technical reached nearly 15%, Sales and Office peaked close to 35%, Other Services maintained over 22.5%, Farming, Fishing, and Forestry declined to about 5%, and Industrial remained roughly at 10%.
Given the complexity of the image, the above description may not be entirely accurate.
Skyrocket your IELTS band score by 1-2 points in under a month with our premium plan!
Note: Both the topic and the answer were created by one of our users.
The data presents information about engagment in USA: technical, sales and office, farming, fishing and foresting, industrial and other services between 1930 to 2010.
Overall, all employment usage changed in given period. The most in demand workforce was farming, fishing and foresting and dimish moderately and stayed on top for long time, while technical showed the worse statistic and edge up marginally. Industrial careers intensify considerably and became a leader.
The involment in the industrial field increased rapidly from zero to thirty two percent in first seventy years on the graph , making it the most popular industry by the end of data. In the same way, technical famous made an upswing from none to twenty five percent and overall trajectory had upward trend.
At first, the farming, fishing and foresting was at its peak and was in the lead, but with time it slightly declined and lost more than half of its own statistic and dropped and became the worst line graph. Sales and office also never had leading positions but had better than farming, fishing and foresting in result.
Word Count: 181
