Our system will evaluate the answer based on this AI-generated description.
The image displays a line graph representing the distribution of household income as a percentage over time from 1965 to 2015 for various categories: accommodation, recreation, food, transport, tax/electricity, savings, and home improvements. Each category has a line indicating the trend over the 50-year period. The y-axis ranges from 0% to 15%, with increments of 1%. Accommodation shows a steady increase from 1965 starting at 6%, reaching around 15% by 2015. Recreation starts at just under 6% in 1965, peaking at nearly 9% around 1975, then fluctuates before ending at around 7% in 2015. Food begins at nearly 11% and has a downward trend reaching around 8% in 2015. Transport starts at 6%, spikes to just over 8% around 1970, drops and fluctuates before ending at around 6% in 2015. Tax/electricity begins at 4%, peaks at 6% around 1975, drops and levels off at about 4% by 2015. Savings start at 6%, experience a sharp increase to nearly 10% by 1975, then gradually decline to 5% in 2015. Lastly, home improvements begin at around 3%, peak to 4% around 1975, and show minor fluctuations before ending at 3% in 2015.
Given the complexity of the image, the above description may not be entirely accurate.
Skyrocket your IELTS band score by 1-2 points in under a month with our premium plan!
Note: Both the topic and the answer were created by one of our users.
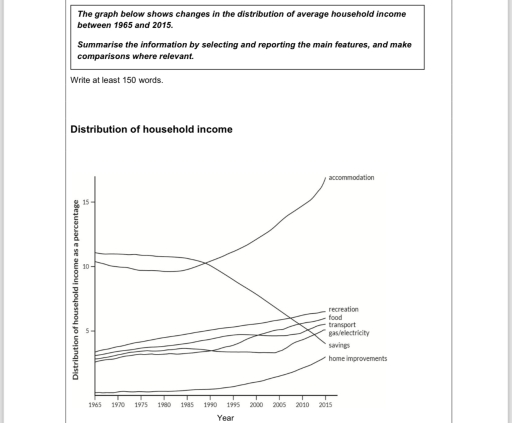
The graph illustrated the percentage of income made from different household facilities at the time period from 1965 untill 2015.
Overall, in most cases figures were following upcoming trends, even though some of them declined or fluctuated. In general, since 1995 the biggest part of them started changing into the higher way.
Taking rising trends first, the sharpest change was made by accommodation, leading it to the first position. Moreover, other aspects, in particular recreation, food and transport, encreased slightly during the duration of time by approximately three percents. At the start in 1965 home improvements stayed at the lowest percentage and during 30 years were stable, however afterwards showed a quick grow.
By contrast, the only figure that declined were savings, becoming almost the lowest result after a great starting point. Thus, in 1990, after having hit a plateau, they decreased in two times. In addition to this, gas and electricity fluctuated at first, but then rose to 5%.
Word Count: 160
