Our system will evaluate the answer based on this AI-generated description.
The image displays a line graph representing the distribution of household income as a percentage over time from 1965 to 2015 for various categories: accommodation, recreation, food, transport, tax/electricity, savings, and home improvements. Each category has a line indicating the trend over the 50-year period. The y-axis ranges from 0% to 15%, with increments of 1%. Accommodation shows a steady increase from 1965 starting at 6%, reaching around 15% by 2015. Recreation starts at just under 6% in 1965, peaking at nearly 9% around 1975, then fluctuates before ending at around 7% in 2015. Food begins at nearly 11% and has a downward trend reaching around 8% in 2015. Transport starts at 6%, spikes to just over 8% around 1970, drops and fluctuates before ending at around 6% in 2015. Tax/electricity begins at 4%, peaks at 6% around 1975, drops and levels off at about 4% by 2015. Savings start at 6%, experience a sharp increase to nearly 10% by 1975, then gradually decline to 5% in 2015. Lastly, home improvements begin at around 3%, peak to 4% around 1975, and show minor fluctuations before ending at 3% in 2015.
Given the complexity of the image, the above description may not be entirely accurate.
Skyrocket your IELTS band score by 1-2 points in under a month with our premium plan!
Note: Both the topic and the answer were created by one of our users.
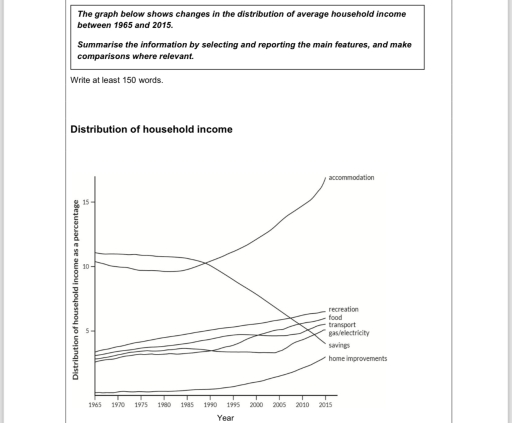
The line graph shows differences in the distribution of amount household revenue from 1965 till 2015.
Overall the accommodation household income the most increased for 10% among the period given,while savings decreased.
As we can see the start of the period Savings category was most popular for 1965-1990 years but in 2010 years it go down about two thirds.Food and gas electric category holds equally same amount of percentage in 2000s but at the start of the period they had very small differences.
Recreation and transport between these years rapidly increased also they took their start with similar percentages around one in twenty and growing till now .As we know currently to accommodation belong the highest percentage..At this point home improvements are the most down one among these.It started with small average and continue its own slow growth till 2015.
Word Count: 140