Our system will evaluate the answer based on this AI-generated description.
The image displays a line graph titled "Average annual expenditure on cell phone, national and international fixed-line services, 2001-2010." Three lines represent different services: cell phone services (dashed line), international fixed-line services (solid line), and national fixed-line services (dotted line). The x-axis represents years from 2001 to 2010, and the y-axis shows expenditure in dollars, ranging from $100 to $800. The cell phone services line shows an upward trend starting at approximately $200 in 2001 and reaching $700 in 2010. The international fixed-line services line shows a downward trend starting at approximately $700 in 2001 and falling to $400 in 2010. The national fixed-line services line remains relatively stable, starting at around $300 in 2001, increasing slightly to $400 in the middle years, and ending around $300 in 2010.
Given the complexity of the image, the above description may not be entirely accurate.
Skyrocket your IELTS band score by 1-2 points in under a month with our premium plan!
Note: Both the topic and the answer were created by one of our users.
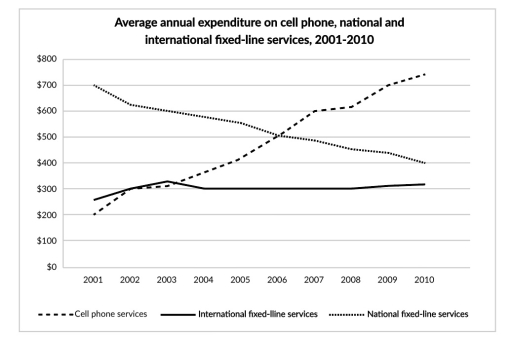
The line graph illustrates the average year-long expenditure on three different services over a ten-year period.
Overall, both cell phone and international fixed-line services’ annual expenditure witnessed a growth over the period shown, but the expenditure on cell phone services was significantly higher. National fixed-line services experienced a slight rise.
In 2001, the average annual expenditure on national fixed-line services was about $700. The expenditure on cell phone and international fixed-line services was lower, at about $200 and $270 respectively. In 2006, the annual expenditure on cell phone services rose dramatically to around $500 while the year-long expenditure on national fixed-line services saw a considerable fall and reached about $500. International fixed-line services grew slightly to $300.
By 2010, the annual expenditure on cell phones hit its peak and reached around $730. Expenditure on National fixed-line services decreased to around $400 while International fixed-line services reached just over $300.
Word Count: 149