Our system will evaluate the answer based on this AI-generated description.
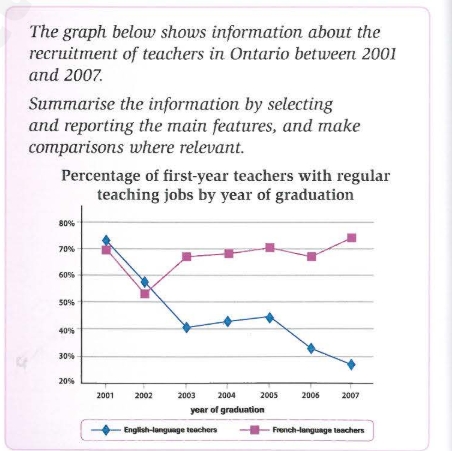
The image presents a line graph with two series depicting the "Percentage of first-year teachers with regular teaching jobs by year of graduation," specifically for English-language teachers and French-language teachers. The x-axis lists the years of graduation from 2001 to 2007, and the y-axis represents the percentage scale from 30% to 80% in increments of 10%. English-language teachers' data points are as follows: 2001 - 70%, 2002 - 68%, 2003 - 54%, 2004 - 42%, 2005 - 38%, 2006 - 40%, and 2007 - 38%. French-language teachers' data points are: 2001 - 76%, 2002 - 74%, 2003 - 70%, 2004 - 60%, 2005 - 48%, 2006 - 50%, and 2007 - 52%. The graph shows an overall decline in the percentage of first-year teachers with regular teaching jobs for both English-language and French-language teachers over the seven-year span, with French-language teachers consistently having a higher percentage compared to English-language teachers each year.
Given the complexity of the image, the above description may not be entirely accurate.
Skyrocket your IELTS band score by 1-2 points in under a month with our premium plan!
Note: Both the topic and the answer were created by one of our users.
The line graph below presents a comparison between teachers in two different scopes, English & French, and their recruitment trend during 6 years, 2001 to 2007.
In 2001, both groups started at almost a same level (70%). In the next step a dramatically decrease happened in them and they fell to somehow 52% in 2002. 2003 came and English – language teachers continued the decrease trend and fell steeply to forty percent. In contrast, the trend of French – lecturers rose slightly and 70% was gained.
until 2005, 43% showed that there was a few increase in English, but then it fell significantly to twenty-eight. A stable progress happened in the next 3 years (from 003-2006) and the line peaked at 75% in French teaching progress.
overall, both groups started at the same position and status in 2001 but after that they taste an opposite trend. However the chart in the middle of the process showed an increase in English, but all in all the process was falling. On the contrary, French face a peak at the end in addition the trend was somehow rising in this period of time.
Word Count: 190
