Our system will evaluate the answer based on this AI-generated description.
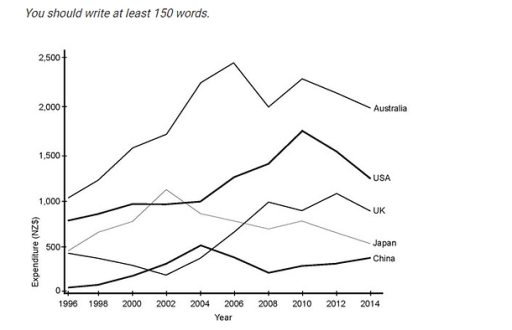
The image presents a line graph illustrating annual expenditure in NZ$ from Australia, USA, UK, Japan, and China between 1996 and 2014. Australia's expenditure rises steadily from around 1,000 in 1996, peaks at 2,500 in 2007, mildly declines to around 2,000 in 2010, and stabilizes near 2,300 in 2014. The USA's expenditure starts just below 1,000 in 1996, escalates to approximately 2,000 in 2002, dips to about 1,200 in 2004, peaks again over 2,000 in 2009, and flattens near 1,500 by 2014. The UK's expenditure begins at 1,000 in 1996, increases to 1,500 around 2001, fluctuates around 1,200 until 2007, and declines steadily to just under 1,000 in 2014. Japan's expenditure starts near 400 in 1996, gradually decreases to around 200 in 2001, fluctuates close to 500 in 2005, and stabilizes below 500 in 2014. China's expenditure commences at 0 in 1996, rises sharply to over 500 by 2003, remains relatively stable around 500, and ends slightly above 500 by 2014.
Given the complexity of the image, the above description may not be entirely accurate.
Skyrocket your IELTS band score by 1-2 points in under a month with our premium plan!
Note: Both the topic and the answer were created by one of our users.
The graph illustrates information about annual visitors to New Zealand from 5 countries for the years 1996 to 2014 over a given period of time.
Overall, it is clear that Australia, USA and UK showed significant change, while China and Japan remained relatively stable.
In datail, Australia, USA and UK started at approximately the same level in 1996 and then increased until 2014 at the end of the period. Meanwhile, annual visitors to Australia (starting at 1000 expenditure) and USA (starting at 800 expenditure) and UK (starting at 500 expenditure) experienced a gradual change, reaching around 2000 expenditure for Australia, and 1100 expenditure for USA, and 800 expenditure for UK.
In contrast, China and Japan showed little variations throughout the period. This suggests that China and Japan had a more significant trend compared to the other categories.
Word Count: 137
