🔥 Today Only: Save 30% on Premium — Offer Ends Soon! - Upgrade Now!
Line Graph

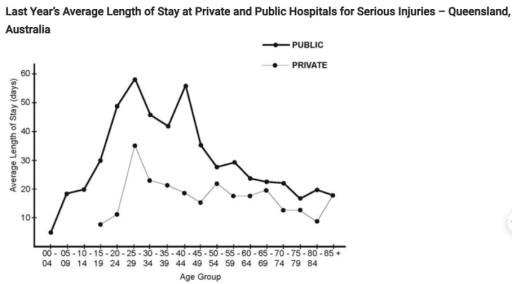
Band 6+: The graph below shows the average length of stay last year (in days) for serious injuries for different age groups in private and public hospitals in Queensland in Australia

Image for topic: The graph below shows the average length of stay last year (in days) for serious injuries for different age groups in private and public hospitals in Queensland in Australia
Our system will evaluate the answer based on this AI-generated description.
The image shows a line graph titled "Last Year's Average Length of Stay at Private and Public Hospitals for Serious Injuries – Queensland, Australia" with two lines representing 'PUBLIC' and 'PRIVATE' hospitals. The X-axis lists age groups: 00-05, 06-10, 11-15, 20-25, 30-35, 40-45, 50-55, 60-65, 70-74, 75-80, 85+; with corresponding years below each group: 04, 09, 14, 19, 24, 29, 34, 39, 44, 49, 54, 59, 64, 69, 74, 79, 84. The Y-axis measures the average length of stay (days), ranging from 0 to 60 in increments of 10. For Public hospitals, the data points for age groups are as follows: 00-05: 35 days, 06-10: 25, 11-15: 25, 20-25: 15, 30-35: 35, 40-45: 52, 50-55: 40, 60-65: 42, 70-74: 20, 75-80: 18, 85+: 18. For Private hospitals, the data points are: 00-05: 20 days, 06-10: 16, 11-15: 20, 20-25: 14, 30-35: 15, 40-45: 20, 50-55: 20, 60-65: 25, 70-74: 18, 75-80: 14, 85+: 14. There are no data points for the 16-19 and 26-29 age groups.
Given the complexity of the image, the above description may not be entirely accurate.
Note: Both the topic and the answer were created by one of our users.

The line graph illustrates last year’s average length of stay at Private and Public hospitals in Queensland, Australia, for serious injuries, showing for different age groups.

In general, it can be seen that middle-aged people, around 20-45, stayed at public hospitals for a long time while people who are between 30 and 65 stayed at private hospitals for the less period.

To begin with public hospitals, younger adults, between 5 and 15, and retirees (55-85) stayed there for around 30 or 25 days. However, middle-aged people remained in public hospitals for the longest time, standing at around 45 and 55 days.

According to private hospitals, the length of staying for the groups, ages between 15-20 and 70-80, stood at 10 days. However, it surged for 35 days in youths. Despite this, it again started decreasing marginally, showing between 20 and 25 days.

Word Count: 142

Answers On The Same Topic:

The graph below shows the average length of stay last year (in days) for serious injuries for different age groups in private and public hospitals in Queensland in Australia

The diagraph demonstrates the average length of stay for the previous year ( in days)for serious injuries for variety aged groups in private and public hospitals in Queensland, Australia. Overall, people started to stay in private and public hospitals more when they started to become middle aged than young and old age ones. To start […]

The graph below shows the average length of stay last year (in days) for serious injuries for different age groups in private and public hospitals in Queensland in Australia

The line graph provides information about how long different aged people stayed for serious injuries in private and public hospitals in Queensland, Australia last year. Overall, there was a noticeable difference in terms of two types of hospitals. In addition, in both public and private hospitals, middle-aged people stayed much more than others. To begin […]

The graph below shows the average length of stay last year (in days) for serious injuries for different age groups in private and public hospitals in Queensland in Australia

The graph illustrates the average continuation of staying for various age groups in private and public hospitals for serious injuries in Queensland, Australia. In general, in every age group, public hospital stays were more than private ones, except the last 85+ age group. One age group demonstrates four-year range. Starting with public hospitals, there were […]

The graph below shows the average length of stay last year (in days) for serious injuries for different age groups in private and public hospitals in Queensland in Australia

The data reports the difference between private and public hostpitals in relation to days staying in each type of hostpitals for serious injuries collected in Queenlands, Australia. Overall, serious injured patients of public hospitals spent longer time staying in hospital in every age groups, compared to the private hospitals’ patients. The groups who spent the […]

See All

Other Topics:

the line graph below shows the household recycling rates in three different countries between 2005 and 2015. Summarize the information by selecting and reporting the main feature and make comparison where relevant .

The line graph below displays the household recycling rate in UK, France, Germany between 2005 and 2015. Overall, UK and Germany household recycling increased significantly, meanwhile France decreased gradually throughout the period and a little bit rose by the end of the time. Germany was the the second biggest consumer of household recycling in 2005 […]

The line graph below shows the average weekly consumption of four types of drinks in a European country between 1980 and 2020. Summarise the information by selecting and reporting the main features, and make comparisons where relevant.

The line graph illustrates the typical weekly usage of four types of drinks, namely milk, coffee, tea and juice in a country in Europe over the period from 1980 to 2020. Overall, the consumption of milk and coffee declined over the period, whereas tea and juice increased its popularity noticeably. Milk was the most consumed […]

The graph below shows life expectancy in different regions of the world from 1950 to 2020. Summarise the information by selecting and reporting the main features, and make comparisons where relevant.

The line graph compares life expectancy in four regions (A to D) from 1950 to 2020. Overall, life expectancy rose in every region over the seventy years, and the gap between the highest and lowest regions narrowed, although the ranking never changed. In 1950, Region A had the highest figure at 65 years, followed by […]

The graph below shows life expectancy in different regions of the world from 1950 to 2020. Summarise the information by selecting and reporting the main features, and make comparisons where relevant.

The line graph compares life expectancy in four regions (A to D) from 1950 to 2020. Overall, life expectancy rose in every region over the seventy years, and the gap between the highest and lowest regions narrowed, although the ranking never changed. In 1950, Region A had the highest figure at 65 years, followed by […]

The graph below shows the average number of Vietnamese students stuying in France, Russia, and America between 2000 and 2015

The line graph illustrates the number of Vietnamese students pursued their studies in France, Russia and America over a period of fifteen years from 2000 to 2015. The scale is measured in millions. Overall, it is evident that the number of pupils educating in France and Russia was the highest as compared to that of […]

the line graph below shows the household recycling rates in three different countries between 2005 and 2015. Summarize the information by selecting and reporting the main feature and make comparison where relevant .

The line chart illustrates the household recycling rates in three European countries: the UK, France, and Germany over a 10-year period from 2005 to 2015. Overall, the figures for two of the three countries saw an upward trend, with the United Kingdom becoming the leader at the end. Of particular note, Germany lagged significantly behind […]

See All
We have detected unusual activity on your device.
Please verify your identity to continue.
Note: This verification step won't sign you in. If you have a premium account, please log in to access the service as usual.
Google/Gmail Verification
Or verify using Email/Code
We've sent a verification code to:
youremail@gmail.com (Not your email?)
Enter it below to complete the verification process.
Ensure your email address is correct, your inbox is not full, and you check your spam folder. If no email arrives, consider using an alternative email.
You will need a Premium plan to perform your action!
Note: If you already have a premium account, please log in to access our services as usual.

Plans & Pricing

Our mission is to make quality education accessible for everyone.
However, to keep our hardworking team running and this service alive, we genuinely need your support!
By opting for a premium plan, not only do you sustain us in achieving the mission, but you also unlock advanced features to enrich your learning experience.

Free

For learners who aren't pressed for time

What's included on Free
100+ Cambridge IELTS Tests
Instant IELTS Writing Task 1 & 2 Evaluation (2 times/month)
Instant IELTS Speaking Part 1, 2, & 3 Evaluation (2 times/month)
Instant IELTS Writing Task 1 & 2 Essay Generator (2 times/month)
500+ Dictation & Shadowing Exercises
100+ Pronunciation Exercises
Flashcards
Other Advanced Tools

Premium

For those serious about advancing their English proficiency, and for IELTS candidates aspiring to boost their band score by 1-2 points (especially in writing & speaking) in just 30 days or less

What's included on Premium
Save Your IELTS Test Progress & Analyze Mistakes By Question Type
Save Your Own Flashcard Sets & Use Them On Any Device
Unlock All Courses, IELTS Tests, Section & Part Practice
Unlimited AI Conversations
Unlimited AI Writing Enhancement Exercises
Unlimited IELTS Writing Task 1 & 2 Evaluation
Unlimited IELTS Speaking Part 1, 2, & 3 Evaluation
Checked Answers Will Not Be Published
Unlimited IELTS Writing Task 1 & 2 Essay Generator
Unlimited IELTS Speaking Part 1, 2, & 3 Sample Generator
Unlimited Usage Of Advanced Tools & AI Features
Priority Support within 24h (12-month plan only)

Due to the nature of our service and the provided free trials, payments are non-refundable.