Our system will evaluate the answer based on this AI-generated description.
The image presents a line graph depicting the average monthly change in prices of copper, nickel, and zinc for the year 2014, measured as percentage change in price compared to previous month. Copper starts at approximately -3.5% in January, peaks at approximately 5% in July, and ends at approximately 0% in December. Nickel starts at approximately -2% in January, peaks at approximately 6.5% in May, and ends at approximately -1.5% in December. Zinc starts at approximately -1.5% in January, peaks at approximately 3.5% in July, and ends at approximately -2% in December. Copper shows a consistent increase from January to July, followed by fluctuations and a decrease towards the end of the year. Nickel shows a sharp increase from April to May, followed by fluctuations with a general downward trend. Zinc shows moderate increases and decreases throughout the year with no clear overall trend. Each data point is marked by a symbol representing the respective metal, with a key provided at the bottom of the graph.
Given the complexity of the image, the above description may not be entirely accurate.
Skyrocket your IELTS band score by 1-2 points in under a month with our premium plan!
Note: Both the topic and the answer were created by one of our users.
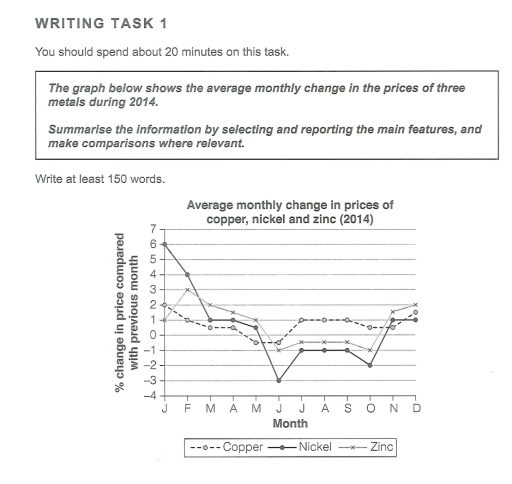
The line graph illustrates the monthly percentage change in the prices of copper, nickel, and zinc in 2014 compared with the previous month.
Overall, nickel prices showed the most dramatic fluctuations, while copper and zinc remained relatively stable. Nickel began with a sharp increase, dropped steeply to the lowest point in June, and then recovered by the end of the year. In contrast, copper and zinc showed only minor ups and downs and stayed within a much narrower range.
In January, nickel rose by around 6%, far above copper at 2% and zinc at 1%. After this, nickel prices fell continuously and reached -3% in June, representing the lowest value among the three metals. During the same months, both copper and zinc also declined, but their changes were much smaller, generally staying between -2% and +2%.
From July onwards, prices of all three metals moved upward. Nickel rebounded from -3% to 1% in December, while copper and zinc increased gradually to finish slightly above 2%, ending the year at a higher level than nickel.
Word Count: 174
