Our system will evaluate the answer based on this AI-generated description.
The image depicts a line graph titled 'Food Consumption in China, 1985-2010 (grams/person/week)'. There are three lines representing Meat, Salt, and Fish. In 1985, Meat starts just above 200g, Salt at roughly 500g, and Fish near 300g. By 1990, Meat increases to nearly 300g, Salt decreases to slightly below 500g, and Fish remains near 300g. In 1995, Meat rises above 400g, Salt drops to around 400g, and Fish stays constant. By 2000, Meat exceeds 600g, Salt continues descent to 350g, and Fish maintains around 300g. In 2005, Meat approaches 800g, Salt falls below 300g, and Fish shows a minor increase. Lastly, in 2010, Meat remains close to 800g, Salt levels off slightly above 200g, and Fish climbs to approximately 350g. The horizontal axis ranges from 1985 to 2010 in increments of 5 years, and the vertical axis measures consumption from 0 to 900 grams in increments of 100 grams.
Given the complexity of the image, the above description may not be entirely accurate.
Skyrocket your IELTS band score by 1-2 points in under a month with our premium plan!
Note: Both the topic and the answer were created by one of our users.
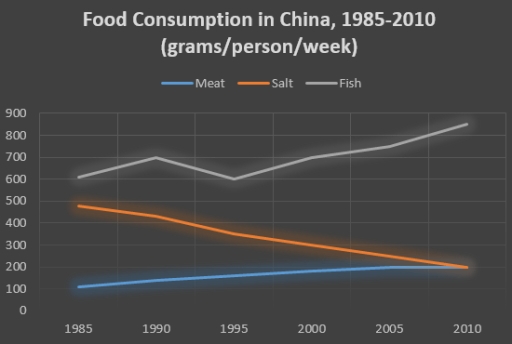
The line graph shows information about food consumption (meat, salt and fish) in China between 1985 and 2010. The trends are measured by grams per person for a week.
Overall, while Meat and Fish increased, the reverse is true for Salt. Overlooking the fluctuations of Fish consumption in the following years, it stood out among other products with consistently increases in each year. Despite the starting rank of both Salt and Meat, however, they ended up with similar numbers.
Between the years 1985 and 2010, a consistent increase witnessed by Meat with ending up at 200 grams per week for a person, with no fluctuations in each year which is similar with Salt at the end. After starting approximately 500 grams in 1985, however, the Salt product was also showed 200 grams per person for weekly consumption in 2010. In comparison, the Fish product rose 250 grams in overall calculations, but also experienced mildly fluctuation between 1985 and 2000. However Fish consumption ended up with being 850 grams per person in week.
Word Count: 172