Our system will evaluate the answer based on this AI-generated description.
The image displays a line graph with x-axis representing years from 1979 to 2004 and y-axis representing grams per person per week from 0 to 300. There are four lines representing different types of meat. The line representing chicken shows an increasing trend starting at around 50 grams per person per week in 1979 and reaching approximately 250 grams per person per week in 2004. The line representing beef shows a decreasing trend starting at approximately 220 grams per person per week in 1979 and decreasing to around 100 grams per person per week in 2004. The line representing lamb shows a sharp decrease from approximately 150 grams per person per week in 1979 to around 50 grams per person per week in 1994 and then plateauing. The line representing fish shows a relatively stable trend with a slight increase, starting and ending at around 50 grams per person per week.
Given the complexity of the image, the above description may not be entirely accurate.
Skyrocket your IELTS band score by 1-2 points in under a month with our premium plan!
Note: Both the topic and the answer were created by one of our users.
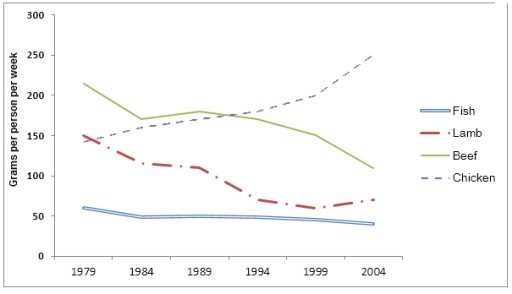
The given illustration provides data about the amount of 4 types of meat, such as fish, lamb, beef and chicken, in a European country from 1980s to 2004. The consumption of fish and meat is measured in grams per person per week.
Overall, what stands out is that chicken has gained popularity, while the consumption of beef has decreased.
To begin with, the two most popular types of meat were beef and chicken in 1979 at well above 200 and 150, respectively. After a decade, grams per person per week of beef dropped abruptly to roughly 170, and by that time it was at the same level as chicken. After 25 years, consumption of beef was not as high as chicken, at nearly 100, when the chicken peaked at 250.
Another interesting point is that lamb was at exactly 150, and fish was at nearly above 50 in 1980’s. By 1989, consumption of lamb fell slightly to the point higher than 100, while the fish stayed at the same level and did not change. In the next 25 years, lamb dropped steadily from 120 to 70.
Word Count: 186
