Our system will evaluate the answer based on this AI-generated description.
The image portrays a line graph detailing U.S. Energy Consumption by Fuel from 1980 to 2030, including both historical data and future projections. Data lines represent consumption values of Petrol and Oil, Coal, Natural Gas, and a combined category for Nuclear, Solar/Wind, and Hydropower. From 1980 to the early 2000s, Petrol and Oil demonstrate a steady increase, starting close to 35 quadrillion units and rising to just over 40. Coal consumption also increases during this period, beginning near 15 and peaking around 25 before a gradual decline. Natural Gas shows a more variable trend, initially at 15, rising to nearly 25, dipping and then recovering to just under 25 by 2005. The combined category remains consistently below 10 quadrillion units. Projection lines suggest Petrol and Oil will plateau around 45, Coal will decline to below 20, Natural Gas will surpass Coal, reaching close to 30, and the combined category will see a slight increase, remaining under 15 quadrillion units.
Given the complexity of the image, the above description may not be entirely accurate.
Skyrocket your IELTS band score by 1-2 points in under a month with our premium plan!
Note: Both the topic and the answer were created by one of our users.
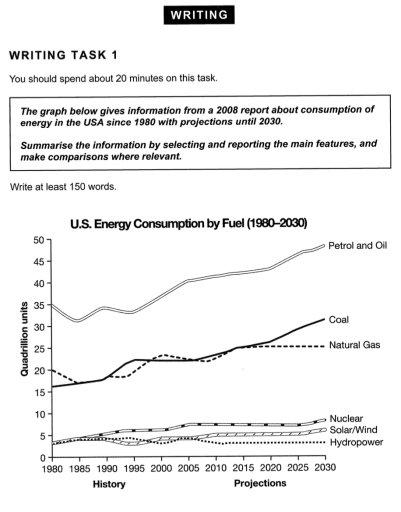
The line graph illustrates energy consumption trends in the US from 1980 to 2030 across six different fuel types, measured in quadrillion units.
Overall, fossil fuels heavily dominate US energy consumption throughout the entire fifty-year period. While petrol and oil, coal, and nuclear power show upward trends, natural gas plateaus, and renewable sources remain low and relatively stable.
Petrol and oil remain the primary energy source, starting at 35 quadrillion units in 1980 and projected to climb steadily to nearly 50 units by 2030. Coal also shows strong growth, rising from 16 units to overtake natural gas around 2015, with expectations to reach about 31 units. Conversely, natural gas fluctuates early on before flatlining at 25 units from 2015 onward.
Meanwhile, clean energy sectors consistently consume under 10 quadrillion units. Nuclear and solar/wind power show modest gains, projected to reach 8 and 6 units respectively by 2030. Hydropower remains the lowest, hovering steadily at around 3 units.
Word Count: 157
