🔥 Today Only: Save 30% on Premium — Offer Ends Soon! - Upgrade Now!
Bar Chart

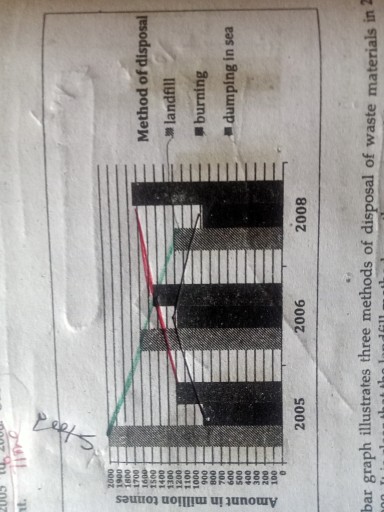
Band 5+: The graph below shows the information on waste disposal in a european country from 2005 to 2008.

Image for topic: The graph below shows the information on waste disposal in a european country from 2005 to 2008.
Our system will evaluate the answer based on this AI-generated description.
The image depicts a bar graph titled "Amount of waste disposed of by method of disposal in 2005, 2006, and 2008," with the x-axis labeled as "Method of disposal" and the y-axis as "Amount in tons." The three methods of disposal are landfilling, burning, and dumping in sea, each represented by a black, white, and striped bar, respectively. Landfilling amounts are 2,008, 2,730, and 3,162 for the years 2005, 2006, and 2008, while burning amounts are 887, 942, and 1,086, and dumping in sea amounts are 577, 672, and 921 for the same years. The graph also includes a green and red line, with the green line representing the amount of waste materials disposed of by other methods, which decreases from 1,370 in 2005 to 877 in 2008, and the red line representing the amount of materials recycled, which increases from 1,890 in 2005 to 2,320 in 2008.
Given the complexity of the image, the above description may not be entirely accurate.
Note: Both the topic and the answer were created by one of our users.

The given column graph illustrates the methods of wate disposal 2005, 2006 and 2008. It is clear that landfill was the most uesd method in 2005 and dumping in sea was used maximum in 2008.

It can be seen that about 2000 million of tonnes of waste was disposed by landfill. This method lost its reputation gradually and reached 1200 million of tonnes in 2008. About 900 million of tonnes of waste was burnt and 1200 million tonnes was dumped in water.

In 2006, again the most popular method was landfill, but the amount was lesser than that in 2005. A little over 1400 million tonnes was dumped in sea and a little under 1200 was burnt.

In 2008, the highest figure belonged to dumping sea method, which accounted for a little over 1000 million tonnes . A little under 900 million tonnes was dumped.

Overall it can be seen that dumping in landfill sites lost popularity and dumping in sea gained popularity in the given time. The burning method of waste disposal fluctuated over the period

Word Count: 177

Answers On The Same Topic:

The graph below shows the information on waste disposal in a european country from 2005 to 2008.

The bar graph dipects three methods of disposal of waste between 2005 and 2008 in European country. Overall it can be seen that, the land fill was the most used mathod whereas dumping in sea experienced decrease. The burning method of the waste dislosal fluctuated over the period. To begin with, it is clear that […]

The graph below shows the information on waste disposal in a european country from 2005 to 2008.

The bar graph provides details about the disposal of waste in a country in a Europe from 2005 to 2008. overall it can be seen that land feel lost popularity and dumping in gained popularity in the time. Then,the burning waste of disposal fluctuated over the period. in 2005, landfill Wast disposal with 2000 million […]

See All

Other Topics:

The bar chart shows the percentage of students in Country X who participated in football, basketball, tennis, and swimming in 2010 and 2020.

The provided bar chart delineates the proportions of students in Country X engaging in four distinct sports – football, basketball, tennis, and swimming – across the years 2010 and 2020. It is evident that football, despite its dominant position in 2010, experienced a notable decline by 2020. Conversely, tennis and swimming witnessed upward trends, while […]

The chart gives information about the age of the population of Iceland between 2020 and 2050. Summarize the information by selecting and reporting the main features, and make comparisons where relevant.

The chart illustrates the projected changes in the age distribution of Iceland’s population from 2020 to 2050. Overall, it’s interesting to note that there will be a steady upward trend in population growth of adults, 25 from 54 ,living in Iceland. To begin with , according to the bar chart, people aged 25-54 started at […]

The chart below shows the percentage of whole world population in four countries from 1950 to 2000, with projections till 2050. Summarize the information by selecting and reporting the main features and make comparisons where relevant.

The bar graph compares the proportions of the world’s population in India, China, the USA and Japan in 1950 and 2000 and also provides projections for 2050. Overall, it is clear that China had the highest proportion of the world’s population during the past period, but India is projected to take the leading position in […]

The chart below shows the annual number of rentals and sales (in various formats) of films from a particular store between 2002 and 2011. Summarize the information by selecting and reporting the main features, and make comparison

The bar chart compares the yearly figures of rentals and sales in 4 different formats (Rentals, VHS, DVD, Blu-ray) of film from a specific store from 2002 to 2011. Overall, DVD sales recorded the higestest figures from 2004 till 2011. on the other hand Blue-ray sales represented least sales throughout the period. while rentals showed […]

The chart below shows the annual number of rentals and sales (in various formats) of films from a particular store between 2002 and 2011. Summarize the information by selecting and reporting the main features, and make comparison

The bar chart compares the yearly figure of rentals and sales in 4 different formats (Rentals, VHS, DVD, Blu ray) of film from a specific store from 2002 to 2011. Overall, DVD sales recorded the higestest figures from 2004 till 2011. on the other hand Blue-ray sales represented least sales throughout the period. while rentals […]

The chart below shows the number of artisans worldwide between 1950, 2000, and 2050. Summarise the information by selecting and reporting the main features and make comparisons where relevant.

The bar chart compares the number of artisans, measured in millions, working in seven different artistic fields in 1950 and 2000, with projections for 2050. Overall, painting and poetry had the highest numbers of artisans in 1950, whereas film making and performing arts are expected to become the most popular fields by 2050. While most […]

See All
We have detected unusual activity on your device.
Please verify your identity to continue.
Note: This verification step won't sign you in. If you have a premium account, please log in to access the service as usual.
Google/Gmail Verification
Or verify using Email/Code
We've sent a verification code to:
youremail@gmail.com (Not your email?)
Enter it below to complete the verification process.
Ensure your email address is correct, your inbox is not full, and you check your spam folder. If no email arrives, consider using an alternative email.
You will need a Premium plan to perform your action!
Note: If you already have a premium account, please log in to access our services as usual.

Plans & Pricing

Our mission is to make quality education accessible for everyone.
However, to keep our hardworking team running and this service alive, we genuinely need your support!
By opting for a premium plan, not only do you sustain us in achieving the mission, but you also unlock advanced features to enrich your learning experience.

Free

For learners who aren't pressed for time

What's included on Free
100+ Cambridge IELTS Tests
Instant IELTS Writing Task 1 & 2 Evaluation (2 times/month)
Instant IELTS Speaking Part 1, 2, & 3 Evaluation (2 times/month)
Instant IELTS Writing Task 1 & 2 Essay Generator (2 times/month)
500+ Dictation & Shadowing Exercises
100+ Pronunciation Exercises
Flashcards
Other Advanced Tools

Premium

For those serious about advancing their English proficiency, and for IELTS candidates aspiring to boost their band score by 1-2 points (especially in writing & speaking) in just 30 days or less

What's included on Premium
Save Your IELTS Test Progress & Analyze Mistakes By Question Type
Save Your Own Flashcard Sets & Use Them On Any Device
Unlock All Courses, IELTS Tests, Section & Part Practice
Unlimited AI Conversations
Unlimited AI Writing Enhancement Exercises
Unlimited IELTS Writing Task 1 & 2 Evaluation
Unlimited IELTS Speaking Part 1, 2, & 3 Evaluation
Checked Answers Will Not Be Published
Unlimited IELTS Writing Task 1 & 2 Essay Generator
Unlimited IELTS Speaking Part 1, 2, & 3 Sample Generator
Unlimited Usage Of Advanced Tools & AI Features
Priority Support within 24h (12-month plan only)

Due to the nature of our service and the provided free trials, payments are non-refundable.