Our system will evaluate the answer based on this AI-generated description.
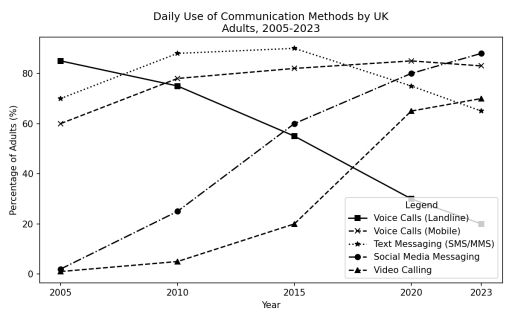
The image shows a line graph titled "Daily Use of Communication Methods by UK Adults, 2005-2023". The vertical axis is labeled "Percentage of Adults (%)" with grid intervals at 0, 20, 40, 60, and 80. The horizontal axis is labeled "Year" with points at 2005, 2010, 2015, 2020, and 2023. The legend includes five categories: "Voice Calls (Landline)" represented by a solid line with square markers, "Voice Calls (Mobile)" represented by a dashed line with x-markers, "Text Messaging (SMS/MMS)" represented by a dotted line with star markers, "Social Media Messaging" represented by a dash-dotted line with circle markers, and "Video Calling" represented by a dashed line with triangle markers. The recorded percentage data for each category across the years 2005, 2010, 2015, 2020, and 2023 are: Voice Calls (Landline): 85% in 2005, 75% in 2010, 55% in 2015, 30% in 2020, and 20% in 2023; Voice Calls (Mobile): 60% in 2005, 78% in 2010, 82% in 2015, 85% in 2020, and 83% in 2023; Text Messaging (SMS/MMS): 70% in 2005, 88% in 2010, 90% in 2015, 75% in 2020, and 65% in 2023; Social Media Messaging: 2% in 2005, 25% in 2010, 60% in 2015, 80% in 2020, and 88% in 2023; Video Calling: 1% in 2005, 5% in 2010, 20% in 2015, 65% in 2020, and 70% in 2023.
Given the complexity of the image, the above description may not be entirely accurate.
Skyrocket your IELTS band score by 1-2 points in under a month with our premium plan!
Note: Both the topic and the answer were created by one of our users.
The given chart gives information about preferences of grown-up individuals in daily used communication methods in the United Kingdom over a twenty-year period.
Overall, it is clear that some of the categories raised popularity over two decades, such as Video Calling, Social Media Messaging, and Mobile Voice Calls . While other two options-Text Messaging and Voice Calls (Landline)-went down.
Looking into details, the sharpest increase was experienced by Social Media Messaging, from total abcense of demand (0%) to 80%, taking place at the top of the chart. Likewise, Video Calling went up from 0% to 60% with the most significant growth from 2015 to 2020. By contrast, Voice Calls (Mobile) showed modest changes and increased gently with some fluctuations.
On the other hand, it is noticeable that former leader, Voice Calls (Landline), reached the bottom of the chart, from 85% to 20% of interested adults. Text Messaging over SMS and MMS slumped as well despite the negligible growth in 2010 and 2015.
Word Count: 162
