Our system will evaluate the answer based on this AI-generated description.
The image features a line graph titled "Population of wild birds: 1970-2004" focusing on the United Kingdom, plotting indices for four bird population categories, depicted over the years 1970 to 2004. The vertical axis ranges from 50 to 140 (index = 1970 = 100), and the horizontal axis represents time. Each category's bird population is represented by a specific line: Coastal species (20 species), All species (111 species), Woodland species (33 species), and Farmland species (19 species). Initially, in 1970, all categories start at an index of 100. Patterns vary distinctly among categories through years:
1. Coastal species index shows a fairly steady increase, starting at 100 in 1970, dipping slightly in the early 1970s, then climbing gradually, reaching around 120 in 2004.
2. All species index begins at 100 in 1970, decreases slightly to below 100 by 1976, fluctuates mildly around this range, and ends near 100 again in 2004.
3. Woodland species index starts at 100 in 1970, exhibits some fluctuation, dipping to approximately 90 by mid-1970s, recovering to 100 by 1980, with slight rises and falls, ending just below 100 by 2004.
4. Farmland species index begins at 100, shows a sharp decline to about 60 by mid-1980s, and maintains a relatively flat trend but slightly recuperates, closing near 70 in 2004.
Given the complexity of the image, the above description may not be entirely accurate.
Skyrocket your IELTS band score by 1-2 points in under a month with our premium plan!
Note: Both the topic and the answer were created by one of our users.
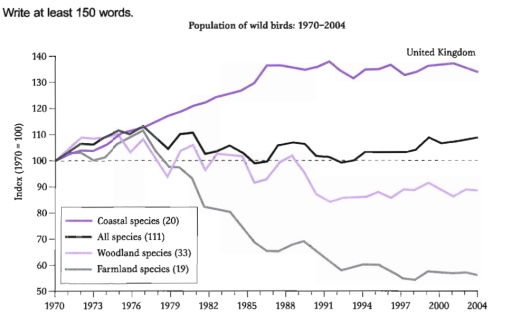
The graph illustrates data about the number of birds of three types: coastal, woodland, and farmland and their total sum, that inhabited the UK over a thirty-four-year period between 1970 and 2004.
Overall, the initial impression from the graph is that only the coastal species followed an upward direction, while the other species showed a significant decrease.
The most considerable growth was in the amount of the coastal population. In general, there was a gradual rise over the first half of the given period, however, from 1997 to 2004, the level fluctuated. The figure peaked four times in 1996, 1992, 1998 and 2003, reaching approximately 140 percent, but recovered to 135 on three of the four occasions.
By contrast, the opposite downward trend was shown by the farmland and the woodland species. The sum of farmland birds had decreased by almost 2 times by 2004. It peaked at 110 percent in 1977 before falling sharply in 1979. The amount had been dropping dramatically for about 10 years when there was a slight increase in 1989. For the last 5 years, the scale decreased steadily. The amount of woodland species had changed the least, with approximately 85 percent by 2004. Despite the decline over most of the period, there was an upward trend between 1992 and 2004.
Despite fluctuated tendency the total sum of the birds had increased in comparison to 1970
Word Count: 231
