🔥 Today Only: Save 30% on Premium — Offer Ends Soon! - Upgrade Now!
Line Graph

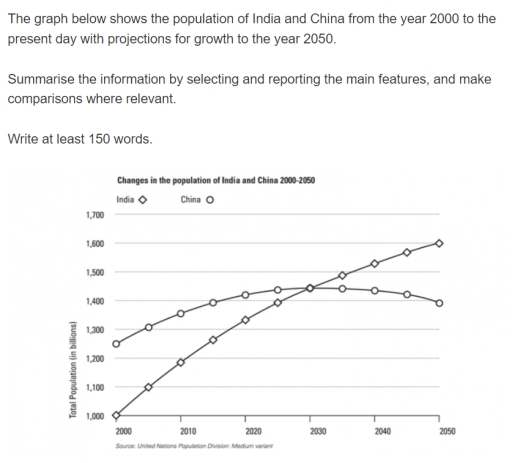
Band 6+: the graph below shows the population of India and china from the year 2000 to the present day with projects for growth to the year 2050

Image for topic: the graph below shows the population of India and china from the year 2000 to the present day with projects for growth to the year 2050
Our system will evaluate the answer based on this AI-generated description.
The image depicts a line graph titled "Changes in the population of India and China 2000-2050", contrasting the populations of India and China from 2000 with forecasts up to 2050. The x-axis indicates years at 10-year intervals from 2000 to 2050, whereas the y-axis measures population in millions from 1,000 to 1,700 in increments of 100. India’s population starts at approximately 1,050 million in 2000, climbing gradually to about 1,200 million by 2010, then to around 1,350 million by 2020, and is projected to reach about 1,500 million by 2030, close to 1,600 million by 2040, and roughly 1,700 million by 2050. China’s population begins at about 1,250 million in 2000, increases slightly to around 1,350 million by 2010, remains near this level by 2020, is forecasted to start a downward trend to approximately 1,320 million by 2030, about 1,280 million by 2040, and approximately about 1,250 million by 2050. The graph clearly projects India's ascending trajectory surpassing China around 2030, where China’s population peaks and then declines.
Given the complexity of the image, the above description may not be entirely accurate.
Note: Both the topic and the answer were created by one of our users.

The line graph illustrates the number of inhabitants in India and China, in centuries from year 2000 to present with presumptions for the future. Overall, India’s population rose steadily as the numbers grew significantly over the years whereas in China, the total population increased gradually before decreasing slowly overtime.

India started off with a low of 1000 billion people in year 2000 before going up by around 100 billion every five years up until 2025, where the numbers then started to decrease slowly to about 50 billion every five years thereafter.

China’s population begun significantly higher than that of India with 250 billion more people respectively. Although China started off with higher values, the number of residents rose markedly slower than in India, with a growth rate of approximately 50 billion every 5 years. These numbers continued to decrease over the years. India and China hit a breakeven point in 2030 with a total of around about 1,450 billion residents. China’s population started to remain stable while India’s proposed numbers continue to climb to a an estimated peak of around 1,600 billion occupants in 2050.

Word Count: 185

Answers On The Same Topic:

the graph below shows the population of India and china from the year 2000 to the present day with projects for growth to the year 2050

The pictorial representation of the line graph illustartes the number of population in neighbouring countries , India and China from the year 2000 to the current date with incline for growth to the year 2050.Overall, a definetive trend towards higher population in India compared to China is an evident , though India has lower rate […]

the graph below shows the population of India and china from the year 2000 to the present day with projects for growth to the year 2050

The line graph displays the number of people living in China and India since the year 2000 and predicts future trends. Overall, it is evident that the Chinese population was relatively bigger in the past but is expected to fall in the future. India’s, on the other hand, is continuously growing and is expected to […]

the graph below shows the population of India and china from the year 2000 to the present day with projects for growth to the year 2050

The chart illustrates the population of India and China between 2000 to present day with predictions for the trend in population in the year 2050. India experienced a linear growth in population throughout the review period. In the year 2000, 1 billion people called India home. The figures rose to 1.2 billion in 2010, a […]

the graph below shows the population of India and china from the year 2000 to the present day with projects for growth to the year 2050

The line graph below demonstrates the number of people living in China and India from 2000 up to 2025, including predictions until 2050. Overall, the population of the two given countries showed a steady increase over the period provided. At the start of the timeline, the population of China was noticeably higher than the number […]

the graph below shows the population of India and china from the year 2000 to the present day with projects for growth to the year 2050

The line graph compares the total number of citizens in billions of two countries from the year 2000 to current day with a prediction for growth until year 2050. Overall, India starts off with least change change in population. meanwhile, China ends with lowest change in population.. In more detail, Total Population of India starts […]

See All

Other Topics:

The line graph below shows the percentage of households in Singapore that owned four different consumer items between 1973 and 2008.

The line graph illustrated the proportion of households in Singapore belonged to four different consumer goods from 1972 to 2008. Units are given in percentages. Overall, all categories experienced a gradual rise throughout the timeframe. Moreover, the highest percentage was presented by washing machine. Following behind, there were car and computer, which remained in the […]

Number of books borrowed from four villages from four village libraries

The line graph provides information about the number of books borrowed from four village libraries: West Eaton, Ryeslip, Sutton Wood, Church Mount between June and September. Overall, Sutton Wood experienced the highest borrowing rate towards the end of the period, while West Eaton and Church Mount ended with the lowest figure. In contrast Ryeslip declined […]

The graph below gives information about the price of bananas in four countries between 1996 and 2004. Summarise the information by selecting and reporting the main features, and make comparisons where relevant.

The line graph depicts information about cost of bananas in four nations namely, Japna, France, Germany, and USA, from the year 1996 to 2004. At the first glance, Japan was witnesed the price of bananas rised in the intial year and it showed a high fluaction over the period of time. While, cost of bananas […]

The graph below shows the changes in food consumption by Chinese people between 1985 and 2010. Summarise the information by selecting and reporting the main features, and make comparisons where relevant.

The line graph illustrates the changes in food consumption of fish, salt and meat among Chinese people from 1985 to 2010. Overall, fish consumption consistently ranked first, although this figure fluctuated throughout the period. Meanwhile, meat increased gradually, whereas salt decreased over the period. Looking first at the most popular food in China,the amount of […]

The line graph below shows the percentage of households in Singapore owned in four different consumer items (computer, car, air conditioning, washing machine) between 1973 and 2008.

The line graph shows the percentage of households with four different types of electronic devices over a period of 35 years, from 1973 to 2008. Overall, it’s clear that all groups saw an upward trend, while the proportions of households with washing machines and cars started at similar levels. Of particular note is that computer […]

The line graph illustrates quantities of particular cow breeds that are found in Connecticut between 2000 and 2014 Summarize the given information by selecting and reporting the main features, and make comparisons where relevant

The figure illustrates how many cows of four breeds were detected in Connecticut from 2000 to 2014. Overview, the figure for Jersey cows was the highest throughout the period, while that for Holstein was the lowest for most of the given time. Moreover, the figures for all categories increased in this period, except for Guernsey […]

See All
We have detected unusual activity on your device.
Please verify your identity to continue.
Note: This verification step won't sign you in. If you have a premium account, please log in to access the service as usual.
Google/Gmail Verification
Or verify using Email/Code
We've sent a verification code to:
youremail@gmail.com (Not your email?)
Enter it below to complete the verification process.
Ensure your email address is correct, your inbox is not full, and you check your spam folder. If no email arrives, consider using an alternative email.
You will need a Premium plan to perform your action!
Note: If you already have a premium account, please log in to access our services as usual.

Plans & Pricing

Our mission is to make quality education accessible for everyone.
However, to keep our hardworking team running and this service alive, we genuinely need your support!
By opting for a premium plan, not only do you sustain us in achieving the mission, but you also unlock advanced features to enrich your learning experience.

Free

For learners who aren't pressed for time

What's included on Free
100+ Cambridge IELTS Tests
Instant IELTS Writing Task 1 & 2 Evaluation (2 times/month)
Instant IELTS Speaking Part 1, 2, & 3 Evaluation (2 times/month)
Instant IELTS Writing Task 1 & 2 Essay Generator (2 times/month)
500+ Dictation & Shadowing Exercises
100+ Pronunciation Exercises
Flashcards
Other Advanced Tools

Premium

For those serious about advancing their English proficiency, and for IELTS candidates aspiring to boost their band score by 1-2 points (especially in writing & speaking) in just 30 days or less

What's included on Premium
Save Your IELTS Test Progress & Analyze Mistakes By Question Type
Save Your Own Flashcard Sets & Use Them On Any Device
Unlock All Courses, IELTS Tests, Section & Part Practice
Unlimited AI Conversations
Unlimited AI Writing Enhancement Exercises
Unlimited IELTS Writing Task 1 & 2 Evaluation
Unlimited IELTS Speaking Part 1, 2, & 3 Evaluation
Checked Answers Will Not Be Published
Unlimited IELTS Writing Task 1 & 2 Essay Generator
Unlimited IELTS Speaking Part 1, 2, & 3 Sample Generator
Unlimited Usage Of Advanced Tools & AI Features
Priority Support within 24h (12-month plan only)

Due to the nature of our service and the provided free trials, payments are non-refundable.