Our system will evaluate the answer based on this AI-generated description.
The image displays a line graph with four different lines, each representing Facebook, Google, Apple, and Yahoo from the years 2011 to 2016. The vertical axis ranges from 0 to 35,000 with increments of 5,000, while the horizontal axis lists the years 2011 through 2016. In 2011, Facebook, Google, and Apple start at 0, while Yahoo starts around 12,000. In 2012, Facebook jumps to over 30,000, Google remains close to 0, Apple increases to around 2,000, and Yahoo drops to about 6,000. By 2013, Facebook drops below 5,000, Google increases to around 5,000, Apple rises to nearly 10,000, and Yahoo decreases to almost 0. In 2014, Facebook remains under 5,000, Google climbs to nearly 20,000, Apple approaches 15,000, and Yahoo stays close to 0. In 2015, Facebook is still below 5,000, Google exceeds 20,000, Apple surpasses 15,000, and Yahoo remains around 0. Finally, in 2016, Facebook stays under 5,000, Google maintains above 20,000, Apple continues to increase exceeding 20,000, and Yahoo stays near 0.
Given the complexity of the image, the above description may not be entirely accurate.
Skyrocket your IELTS band score by 1-2 points in under a month with our premium plan!
Note: Both the topic and the answer were created by one of our users.
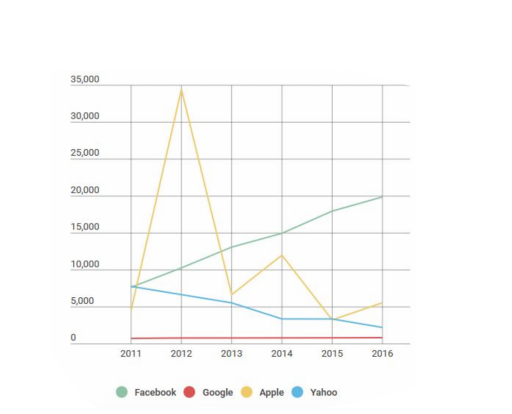
The bar graph depicts the stock prices of four technological companies namely Facebook,Google,Apple and Yahoo between the years 2011 to 2016.
Overall Apple has shown a tremendous increase in the year 2012 which crossed over 30,000 ,whereas Google has managed to reamin the lowest all throughout .
There is a steady increase in Facebook stocks in the subsequent years from 2011 which was nearly at 7,000 to just under 20,000 in the year 2016 .Apple on the other hand has variable hikes and drops all through , having a massive drop in 2015 at aproximately 3,000 which shows improvment the following year at about 6,000.
Yahoo on the other hand has had an almost steady decline in the sucessive years ,their highest being close to 7,000 in 2011 and hitting their lowest in 2016 at just close to 2,000.During the years 2014 and 2015 their stocks have managed to reamain the same around just above 3,000. Google has had no significant improvement the entire timeline spanning between 2011 to 2016.
Word Count: 170
