Our system will evaluate the answer based on this AI-generated description.
The image contains a line graph showing Twitter use by age group over 8 time points: 10/11, 11/01, 11/05, 11/08, 12/02, 12/08, 12/12, 13/05. Age groups are represented as 18-29, 30-49, 50-64, 65+. At 10/11, 18-29 usage is around 30%, 30-49 around 15%, 50-64 around 5%, 65+ just under 5%. At 11/01, 18-29 increases to just under 35%, 30-49 to just above 15%, 50-64 and 65+ remain steady. At 11/05, 18-29 drops to just above 30%, 30-49 rises to 20%, 50-64 to almost 10%, 65+ to almost 5%. At 11/08, 18-29 rises to just under 35%, 30-49 to just over 20%, 50-64 to just over 10%, 65+ to just over 5%. At 12/02, 18-29 drops to 30%, 30-49 drops to 15%, 50-64 rises to 12.5%, 65+ drops to 5%. At 12/08, 18-29 rises to almost 35%, 30-49 rises to 20%, 50-64 to almost 15%, 65+ to just over 5%. At 12/12, 18-29 drops to just above 30%, 30-49 drops to just over 15%, 50-64 rises to 15%, 65+ to just under 5%. At 13/05, 18-29 rises to just below 35%, 30-49 to just over 20%, 50-64 to just under 15%, 65+ remains steady.
Given the complexity of the image, the above description may not be entirely accurate.
Skyrocket your IELTS band score by 1-2 points in under a month with our premium plan!
Note: Both the topic and the answer were created by one of our users.
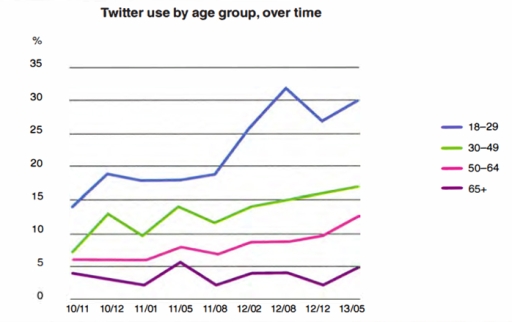
Overall, Twitter usage increased across all age groups over the period. The 18-29 age group consistently recorded the highest proportion of users, whereas people aged 65 and over remained the least likely to use the platform. Although there were some fluctuations, all groups showed an upward trend by the end of the period.
At the beginning of the survey, approximately 14% of people aged 18-29 used Twitter. This figure rose to around 19% by late 2010 before remaining relatively stable for about a year. It then increased sharply, reaching a peak of roughly 33% in August 2012. After a slight decline to about 29%, the proportion recovered to just over 30% in May 2013.
The percentage of users aged 30-49 also grew overall, climbing from around 7% to nearly 19%. Despite a few fluctuations in the first half of the period, the trend became steadier after 2011. Similarly, the figure for the 50-64 age group more than doubled, increasing from approximately 6% to around 15% by the end of the survey.
By contrast, the oldest group experienced the lowest levels of Twitter use throughout. Starting at about 4%, the percentage fluctuated between 2% and 6% before finishing at roughly 7% in May 2013.
Word Count: 203
