🔥 Today Only: Save 30% on Premium — Offer Ends Soon! - Upgrade Now!
Bar Chart

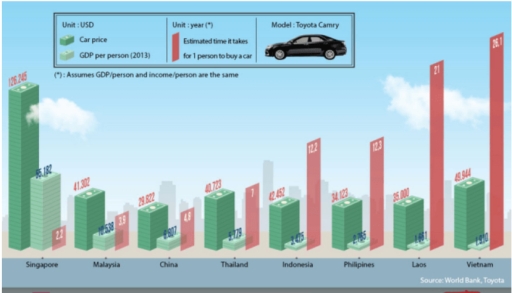
Band 6+: The graph illustrates the relationship between the GDP per capita, the cost of a Toyota Camry, and the estimated duration for an individual citizen to afford purchasing that vehicle in eight Asian nations. Summarise the information by selecting and reporting the main features, and make comparisons where relevant.

Image for topic: The graph illustrates the relationship between the GDP per capita, the cost of a Toyota Camry, and the estimated duration for an individual citizen to afford purchasing that vehicle in eight Asian nations. Summarise the information by selecting and reporting the main features, and make comparisons where relevant.
Our system will evaluate the answer based on this AI-generated description.
The image displays a bar graph labelled with eight countries and three different measurements; car price in USD, GDP per person (2013) in USD, and estimated time in years for one person to buy a car, represented by bars in varying heights. The car model is a Toyota Camry. The data reads as follows: Singapore - car price $110,760, GDP per person $55,182, time 2; Malaysia - car price $51,217, GDP per person $10,538, time 5; China - car price $41,894, GDP per person $6,807, time 6; Thailand - car price $40,508, GDP per person $5,779, time 7; Indonesia - car price $35,768, GDP per person $3,475, time 10; Philippines - car price $37,391, GDP per person $2,765, time 14; Laos - car price $44,322, GDP per person $1,660, time 27; Vietnam - car price $51,484, GDP per person $1,890, time 27. There's a note that states "(*) Assumes GDP/person and income/person are the same".
Given the complexity of the image, the above description may not be entirely accurate.
Note: Both the topic and the answer were created by one of our users.

This bar chart shows the cost of Toyota Camry, GDP per person and approximate time it takes for one person to buy a car in eight different Asian cities.

Overall, there is a huge difference between the car price in Singapore and other countries, in the GDP per person and the estimated time it takes for a person to buy a car in Singapore and in other countries. Other than singapore there is not much difference in per capita GDP in countries however gradual increase can be seen in estimated time it takes a person to buy a car in the chart.

In Singapore city price of Toyota Camry is 126.245 USD higher than all other cities and GDP per person in Singapore is also very high as compared to other cities. Despite of higher price in Singapore it takes only 2.2 years to buy a car in Singapore. Per capita GDP is dropping to 1.910 in Vietnam as compared to 55.185 in Singapore.

The total time it takes for a person to buy a car is gradually increasing from 2.2 to 26.1 years in Singapore and Vietnam respectively. The sudden drop in car price in Malaysia in comparison to Singapore can be seen however there is not much significant change in car price from the Malaysia to Vietnam.

Word Count: 219

Answers On The Same Topic:

The graph illustrates the relationship between the GDP per capita, the cost of a Toyota Camry, and the estimated duration for an individual citizen to afford purchasing that vehicle in eight Asian nations. Summarise the information by selecting and reporting the main features, and make comparisons where relevant.

The bar graph illustrates the differences of the income per person , price of a Toyota Camry and time for a person to buy that transport mode in 8 south east asia cointries. Cost of the Toyota Camry in Asian countries don’t have a enormous differece, 7 out of 8 countries are in range between […]

The graph illustrates the relationship between the GDP per capita, the cost of a Toyota Camry, and the estimated duration for an individual citizen to afford purchasing that vehicle in eight Asian nations. Summarise the information by selecting and reporting the main features, and make comparisons where relevant.

The graph compares the GDP per capita, cost of a Toyota Camry and approximate length of time it takes for 1 citizen to purchase that mode of transport in eight Asian countries. Despite having the second lowest average yearly income, it costs more to buy this car in Vietnam than in all but one other […]

The graph illustrates the relationship between the GDP per capita, the cost of a Toyota Camry, and the estimated duration for an individual citizen to afford purchasing that vehicle in eight Asian nations. Summarise the information by selecting and reporting the main features, and make comparisons where relevant.

The graph illustrates the prices of a Toyota car and the per person GDP in different countries, alongwith the approximate number of years it takes for an individual to purchase it. Despite of costing a staggering $126000, Singaporeans were able to purchase the car in only about 2.2 years due to their high income in […]

The graph illustrates the relationship between the GDP per capita, the cost of a Toyota Camry, and the estimated duration for an individual citizen to afford purchasing that vehicle in eight Asian nations. Summarise the information by selecting and reporting the main features, and make comparisons where relevant.

The graph compares the data of buying a Toyota Camry model car in different south east asian countries using various measuring points like car price, GDP per person and the time it takes for a person to buy a car. First of all, let us talk about the car price. It is interesting to note […]

The graph illustrates the relationship between the GDP per capita, the cost of a Toyota Camry, and the estimated duration for an individual citizen to afford purchasing that vehicle in eight Asian nations. Summarise the information by selecting and reporting the main features, and make comparisons where relevant.

The graph compares the GDP per capita, cost of a Toyota Camry and approximate length of time it takes for 1 citizen to purchase that mode of transport in eight Asian countries. Despite having the second lowest average yearly income, it costs more to buy this car in Vietnam than in all but one other […]

See All

Other Topics:

The bar chart gives information about the percentage of workers in different sectors of employment in three countries at different stages of economic development.

The chart gives information on proportion of people from Japan Brazil and India who are involved in three sectors of economics at different levels of development. Overall, the vast majority of Indian people are involved in agricultural sector, but considerably less in the others two sectors, while Japanese employees have a highest percentage of participation […]

The chart below shows the main reasons for deforestation in three different regions of the world during two separate decades. Summarise the information by selecting and reporting the main features and make comparisons where relevant.

The bar chart compares the main causes of deforestation in three regions: South America, Southeast Asia, and Central Africa. The figures are percentages of forest loss. Overall, each region has a different main reason. In South America, one cause is considerably bigger than the others, whereas in the other two regions, the causes are more […]

The chart below shows the main reasons for deforestation in three different regions of the world during two separate decades. Summarise the information by selecting and reporting the main features and make comparisons where relevant.

The bar chart compares the main causes of deforestation in three regions: South America, Southeast Asia, and Central Africa. The figures are percentages of forest loss. Overall, each region has a different main reason. In South America, one cause is considerably bigger than the others, whereas in the other two regions, the causes are more […]

The bar chart shows the amount of lisure time enjoyed by men and women of different employment status

The bar graph represents the free time spent hours per weeks according to neumourse occupation status among males and females between 1998 and 1999. Overall, it is obvoius that unemployed and retired between men and women had the highest amount of free time. Futhermore, the number of leisure time varied among them in housewives, full […]

The bar chart shows information about the favorite subjects of students from two middle schools, school A and school B

The bar chart illustrates the number of students who chose different subjects in two middle schools, School A and School B. Overall, there were considerable differences in the popularity of the subjects between the two schools, with social science being the only exception. Sport was the most popular subject in School A, whereas craft/drawing was […]

the bar chart shows the rate of attenders to the sport activities in boy and girls

The bar chart illustrates the proportion of Australian attendee of four distinct sport activities after school in 2010 devided by gender, male and female. Overall, more boys attended sports such as football and basket ball, while girls’ attending rate excceded in swimming, netball, and no sports as well. The participation rate in no sports was […]

See All
We have detected unusual activity on your device.
Please verify your identity to continue.
Note: This verification step won't sign you in. If you have a premium account, please log in to access the service as usual.
Google/Gmail Verification
Or verify using Email/Code
We've sent a verification code to:
youremail@gmail.com (Not your email?)
Enter it below to complete the verification process.
Ensure your email address is correct, your inbox is not full, and you check your spam folder. If no email arrives, consider using an alternative email.
You will need a Premium plan to perform your action!
Note: If you already have a premium account, please log in to access our services as usual.

Plans & Pricing

Our mission is to make quality education accessible for everyone.
However, to keep our hardworking team running and this service alive, we genuinely need your support!
By opting for a premium plan, not only do you sustain us in achieving the mission, but you also unlock advanced features to enrich your learning experience.

Free

For learners who aren't pressed for time

What's included on Free
100+ Cambridge IELTS Tests
Instant IELTS Writing Task 1 & 2 Evaluation (2 times/month)
Instant IELTS Speaking Part 1, 2, & 3 Evaluation (2 times/month)
Instant IELTS Writing Task 1 & 2 Essay Generator (2 times/month)
500+ Dictation & Shadowing Exercises
100+ Pronunciation Exercises
Flashcards
Other Advanced Tools

Premium

For those serious about advancing their English proficiency, and for IELTS candidates aspiring to boost their band score by 1-2 points (especially in writing & speaking) in just 30 days or less

What's included on Premium
Save Your IELTS Test Progress & Analyze Mistakes By Question Type
Save Your Own Flashcard Sets & Use Them On Any Device
Unlock All Courses, IELTS Tests, Section & Part Practice
Unlimited AI Conversations
Unlimited AI Writing Enhancement Exercises
Unlimited IELTS Writing Task 1 & 2 Evaluation
Unlimited IELTS Speaking Part 1, 2, & 3 Evaluation
Checked Answers Will Not Be Published
Unlimited IELTS Writing Task 1 & 2 Essay Generator
Unlimited IELTS Speaking Part 1, 2, & 3 Sample Generator
Unlimited Usage Of Advanced Tools & AI Features
Priority Support within 24h (12-month plan only)

Due to the nature of our service and the provided free trials, payments are non-refundable.