Our system will evaluate the answer based on this AI-generated description.
The image displays a bar graph comparing average Saturday sales of two bakeries—Lovely Loaves (red) and Bernie's Buns (blue) in various categories in 2010. In the Cake category, Lovely Loaves sold approximately 80, while Bernie's Buns sold 90. For Cheesecake, Lovely Loaves had sales around 50, contrasting with Bernie's Buns at about 60. Bread sales showed Lovely Loaves at 40, and Bernie's Buns at approximately 80. Biscuits saw Lovely Loaves with 60, and Bernie's Buns with 80. In the category of Tarts, each bakery sold equally at around 20. Muffins had Lovely Loaves recording sales of 50, while Bernie's Buns had 40. Pastries saw Lovely Loaves with sales of about 40, compared to Bernie's Buns at 50. Lastly, in Croissants, Lovely Loaves sold 80 with Bernie's Buns at 120, while Doughnuts had Lovely Loaves at 120 compared to Bernie's Buns at 140.
Given the complexity of the image, the above description may not be entirely accurate.
Skyrocket your IELTS band score by 1-2 points in under a month with our premium plan!
Note: Both the topic and the answer were created by one of our users.
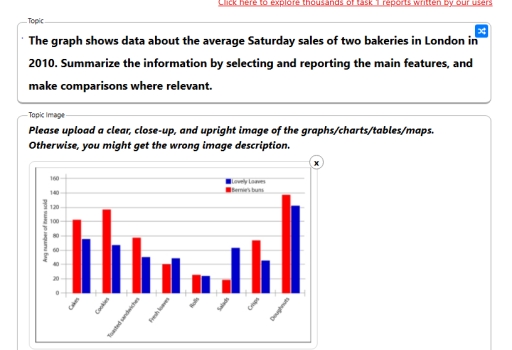
The bar chart illustrates information about the average sales of eight different items from two bakeries (Lovely Loaves and Bernie’s Buns) in London in 2010.
Overall, it can be seen that doughnuts were the best-selling item in both bakeries. However, the sales volumes for other items varied considerably between the two businesses.
For Bernie’s Buns, nearly 140 doughnuts were sold on every Saturday. The second and third best-selling items in store were cookies and cakes, at around 120 and 100 respectively. Crisps and toasted sandwiches also sold well, with more than 70 items sold every Saturday. However, fresh loaves, rolls and salads were poor sellers, with fewer than 40 items sold every Saturday.
On the other hand, Lovely Loaves had some different sales figures. Doughnuts sold 20 fewer items compared to Bernie’s Buns. Besides doughnuts, cookies and cakes also sold fewer items than Bernie’s Buns, at around 70 and nearly 80 respectively. Additionally, fresh loaves and rolls sales were not significantly different. However, salads at Lovely Loaves sold more than three times as many as at Bernie’s Buns (60 vs 20).
Word Count: 181