Our system will evaluate the answer based on this AI-generated description.
The image displays a line graph illustrating the average trip length in miles for U.S. children aged 5 to 15 over a period from 1970 to 2020, with measurements every decade. Data points for walking start from about 0.5 miles in 1970, peaking near 1 mile in 2010, and slightly decreasing to around 0.8 miles by 2020. Cycling begins at approximately 1.5 miles in 1970, rises to just below 2 miles in 1990, and maintains that length through 2020. The bus line starts around 10 miles in 1970, increases to roughly 15 miles by 1990, peaking at 20 miles in 2000, before it ends near 17 miles in 2020. Car travel starts near 3 miles in 1970, steadily climbs to just above 15 miles in 2000, and maintains this distance through 2020. The train line shows a starting point around 25 miles in 1970, falls to 20 miles in 1980, recovers to about 25 miles in 2000, decreases to slightly below 20 miles in 2010, before reaching almost 30 miles by 2020. Lastly, taxi usage begins around 3 miles in 1970, demonstrating a peak at approximately 10 miles in 2000 before slightly decreasing to 8 miles in 2020.
Given the complexity of the image, the above description may not be entirely accurate.
Skyrocket your IELTS band score by 1-2 points in under a month with our premium plan!
Note: Both the topic and the answer were created by one of our users.
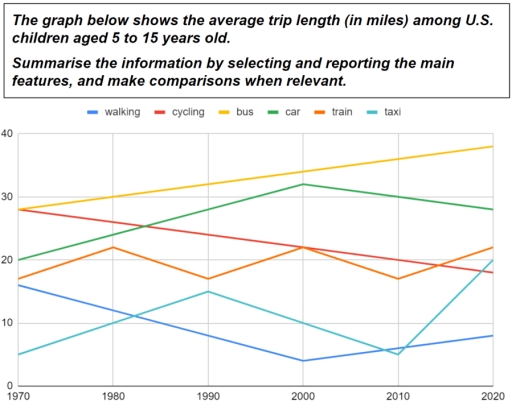
The line graph compares the average amount of miles passed by American children aged from 5 to 15 over a trip by 5 different means of transport between 1970 and 2020.
Overall, buses maintained their position as the transport used for the longest trips, whereas the length of trips on a bicycle continuously shrank. The car trips got longer, experiencing a slight decrease in the last few recorded years, the same as taxis, which, however, rose sharply later.
The length of train trips fluctuated during the whole period, either losing or gaining around 5 miles every ten years, starting from about 8 miles in 1970 and finishing at about 22 miles in 2020. Taxi trips recorded less frequent, but much sharper fluctuations, with a low of about 5 miles both in 1970 and 2010, peaking first at around 5 in 1990 and then at 20 miles in 2020.
While car trips got longer from 1970 to 2000, from 20 to just above 30 miles, a moderate decline to about 28 miles was recorded by 2020. Gradually shorter trips were made by those walking, the miles dropping from almost 20 to barely 5 from 1970 to 2000.
Word Count: 196
