Our system will evaluate the answer based on this AI-generated description.
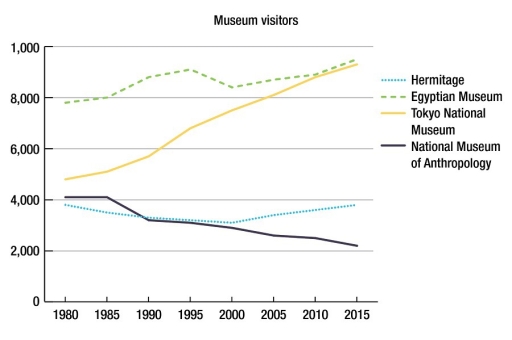
The image displays a line graph titled "Museum visitors" with the x-axis showing years from 1980 to 2015 in intervals of 5 and the y-axis showing visitor numbers from 0 to 10,000 in intervals of 2,000. There are four lines representing different museums: the Hermitage with a dotted line, Egyptian Museum with a dashed line, Tokyo National Museum with a solid bold line, and National Museum of Anthropology with a fine solid line. The Hermitage line starts just above 2,000 in 1980 and ends just below 10,000 in 2015, showing a steady increase with slight fluctuations. The Egyptian Museum line starts around 1,500 in 1980 and ends above 8,000 in 2015, showing a steeper increase with some fluctuations. The Tokyo National Museum line starts just below 2,000 in 1980 and ends over 6,000 in 2015, with a gradual increase and some periods of stability. The National Museum of Anthropology line starts just above 6,000 in 1980 and ends just below 4,000 in 2015, showing a decline with minor fluctuations.
Given the complexity of the image, the above description may not be entirely accurate.
Skyrocket your IELTS band score by 1-2 points in under a month with our premium plan!
Note: Both the topic and the answer were created by one of our users.
This graph shows that count of museum visitors from 1980 to 2015, in four different museums
Firstly, Egyptian Museum had the most visitors between the all museums, average 8.500 people visited the this mueseum every year in the 35 years. it’s visitor count increased constantly until the 1995. After the that time, visitor numbers decresad during 5 years although the number of visitors increased againly by 2015.
Secondly, Tokyo National Musesum had more visitors other muesums, except eygptian museum. It’s visitors increased increased continiously so this museum visitors count almost equals to eyptian museum in 2015
Thirdly, More than 4000 people visited National Museum of Anthropology in 1980 and 1985 but from this year, Its visitors decreased step by step therefore there was about 2.100 visitiors of National Museum of Anthroplogy in the 2015 and this is the least visitor count in one year according the table.
Fourthly, Hermitage had the almost 4000 visitors in 1980 and its visitors count decreased until 1990 at that time Hermitage and National Muesum of Anthropology ‘s visitors count was same two of them had 3600 visitors. After 10 years that time Hemitage’s visitor counts started to increasing
Word Count: 194
