Our system will evaluate the answer based on this AI-generated description.
The image displays a line graph titled "Museum visitors" with the x-axis showing years from 1980 to 2015 in intervals of 5 and the y-axis showing visitor numbers from 0 to 10,000 in intervals of 2,000. There are four lines representing different museums: the Hermitage with a dotted line, Egyptian Museum with a dashed line, Tokyo National Museum with a solid bold line, and National Museum of Anthropology with a fine solid line. The Hermitage line starts just above 2,000 in 1980 and ends just below 10,000 in 2015, showing a steady increase with slight fluctuations. The Egyptian Museum line starts around 1,500 in 1980 and ends above 8,000 in 2015, showing a steeper increase with some fluctuations. The Tokyo National Museum line starts just below 2,000 in 1980 and ends over 6,000 in 2015, with a gradual increase and some periods of stability. The National Museum of Anthropology line starts just above 6,000 in 1980 and ends just below 4,000 in 2015, showing a decline with minor fluctuations.
Given the complexity of the image, the above description may not be entirely accurate.
Skyrocket your IELTS band score by 1-2 points in under a month with our premium plan!
Note: Both the topic and the answer were created by one of our users.
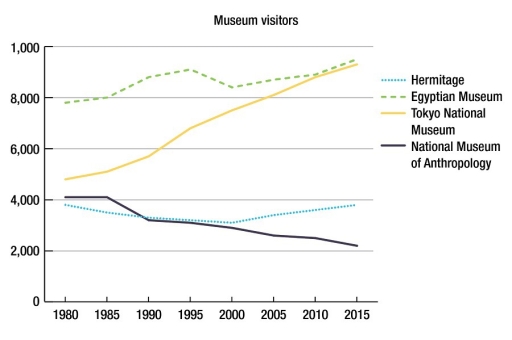
The line graph demonstrates four international museums’ total amount of visits during the period from 1980 to 2015.
Overall, the Tokyo National Museum and the Egyptian Museum experienced upwards trends, while the National Museum of Anthropology saw a general decline. In contrast, the Hermitage was the only option whose popularity largely stabilized.
Firstly, the Egyptian Museum started with a minimal increase, then rose at a noticeable pace in the next ten years. After that, the number dipped slightly and gradually picked up until 2015. Similarly, the Tokyo National Museum began with a modest rise, then escalated sharply between 1990 and 1995 by roughly one-fifth. From 1995 onwards was a progressive growing period which ended with an all-time high of just under 10 million visitors.
On the other hand, sightseers to the National Museum of Anthropology remained unchanged in the first five years, then saw a moderate shrink by around 1,000. Subsequently, the number steadily but minimally declined from 1990, and sinked to a record low with half the starting amount. Furthermore, that figure of the Hermitage also experienced a gradual drop by one-fourth until 2000. However, it slowly went up to the original favorability in 2015.
Word Count: 196
