🔥 Today Only: Save 30% on Premium — Offer Ends Soon! - Upgrade Now!
Multiple Graphs

Band 7+: The graphs below show the cinema attendants in Australia and the average cinema visits by different age groups from 1996 to 2000. Summarise the information by selecting and reporting the main features, and make comparisons where relevant.

Image for topic: The graphs below show the cinema attendants in Australia and the average cinema visits by different age groups from 1996 to 2000. Summarise the information by selecting and reporting the main features, and make comparisons where relevant.
Our system will evaluate the answer based on this AI-generated description.
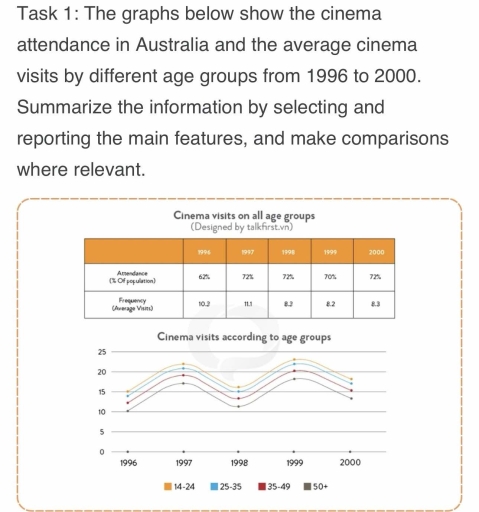
The image displays data on cinema attendance in Australia from 1996 to 2000: Attendance averaged as percentages of the population are 62% in 1996, 72% in 1997, 72% in 1998, 70% in 1999, and 72% in 2000; Frequency averaged as visits are 10.3 in 1996, 11.1 in 1997, 8.2 in 1998, 8.2 in 1999, and 8.3 in 2000; Cinema visits segmented by age groups from 1996-2000 where age 14-24 recorded approximately 19 visits in 1996, 23 visits in 1997, 15 visits in 1998, 18 visits in 1999, 13 visits in 2000; age 25-34 logged about 14 visits in 1996, 15 visits in 1997, 10 visits in 1998, 13 visits in 1999, 11 visits in 2000; age 35-49 noted close to 11 visits in 1996, 16 visits in 1997, 9 visits in 1998, 12 visits in 1999, 13 visits in 2000; age 50+ reported roughly 13 visits in 1996, 12 visits in 1997, 5 visits in 1998, 11 visits in 1999, 12 visits in 2000.
Given the complexity of the image, the above description may not be entirely accurate.
Note: Both the topic and the answer were created by one of our users.

The table compares the proportion of Australians who visited cinemas and their average attendance between 1996 and 2000, while the line graph illustrates cinema attendance across four age groups.

Overall, cinema participation peaked at 72% in 1997 and 1998, while the average number of visits reached its highest point in 1997. People aged 14-24 consistently visited cinemas most frequently, whereas those aged 50 and above recorded the lowest figures.

Regarding the table, the proportion of cinema-goers increased from 62% in 1996 to 72% in 1997, remaining stable until 1998. It then dipped slightly to 70% in 1999 before recovering to 72% in 2000. Meanwhile, average attendance rose from 10.3 visits to a peak of 11.1 in 1997, before falling considerably to 8.3 in 1998 and remaining almost unchanged thereafter.

Turning to the line graph, all four age groups followed a similar upward trend. Initially, the 14-24 group recorded the highest attendance at 15, followed by the 25-35 and 35-49 groups at 14 and 13 respectively. Those aged 50+ recorded the lowest figure, at 10. By 2000, attendance had increased by approximately three people across all groups.

Word Count: 186

Answers On The Same Topic:

The graphs below show the cinema attendants in Australia and the average cinema visits by different age groups from 1996 to 2000. Summarise the information by selecting and reporting the main features, and make comparisons where relevant.

The provided charts delineate the percentage of the Australian population attending cinemas, alongside the average frequency of cinema visits per person, segmented by age cohorts over the period from 1996 to 2000. A clear upward trajectory in overall attendance is evident, reaching a peak of 72% in 1997 and 1998. However, the average number of […]

The graphs below show the cinema attendants in Australia and the average cinema visits by different age groups from 1996 to 2000. Summarise the information by selecting and reporting the main features, and make comparisons where relevant.

The table illustrates the proportion of people working at the cinema and the frequency of cinema visits in Australia between 1996 and 2000, while the graph shows the average number of people going to the cinema based on different ages. Overall, the number of attendees experienced an upward trend, while the frequency of visits decreased […]

The graphs below show the cinema attendants in Australia and the average cinema visits by different age groups from 1996 to 2000. Summarise the information by selecting and reporting the main features, and make comparisons where relevant.

The graph illustrates information about cinema attendance among four different age groups in Australia between 1990 and 2010. Overall, people aged 14-24 had the highest rate of cinema attendance throughout the period, whereas those aged 50 and above consistently had the lowest attendance rate. The percentage of 14-24-year-olds attending the cinema fluctuated between approximately 87% […]

The graphs below show the cinema attendants in Australia and the average cinema visits by different age groups from 1996 to 2000. Summarise the information by selecting and reporting the main features, and make comparisons where relevant.

The line graph illustrates data about film attendance per year in Australia from the year 1990 to 2010. By looking at the overall trend of the chart, people aged 14-24 went to the cinema the most every year, starting from 1990 to 2010. However, individuals who are 50 years old and above are the least […]

See All

Other Topics:

The first chart below shows the reasons why adults decide to study in 2005. The second chart gives information about how the costs of adult education should be shared.

The bar chart represents the reasons why adults studied in 2005 and the pie chart provides information about how educational expenses ought to be shared. Overall, the highest number of adults studied for interest in subject, whereas meeting with people was the least common reason for studying. For bearing cost of education, individuals paid most […]

the chart below show the reasons of students to study a particular in a UK universaty in the year 1987 and 2007.

The pie charts illustrate the distribution of students driven by different factors to study in a UK university over the 20-year period from 1987 to 2007. Overall, it is apparent that suitable degree courses constituted the largest proportion throughout the period, whereas other factors lagged behind. Turning to the most significant categories, the share of […]

Charts A and B show the share of the UK and Australian cinema market in 2001 and cinema admission in the UK and Australia from 1976 to 2006.

The chart A illustrates the films screened in the UK and Australia in 2001; while the give line graph B depicts the cinema admissions in the UK and Australian from 1976 to 2006. Overall, US Films accounted for the largest proportion of cinema market; whereas Australian Films experienced the lowest. Regarding cinema admissions, it is […]

The table gives information on the location and types of dance young people in a town in Australia are currently attending. Summarise the information by selecting and reporting the main features, and make comparisons where relevant.

The given charts illustrate the information on the location and types of dance classes two age groups are currently attending in a town in Australia Overall, it is noticeable that most common location of dance classes are private studios, and least common one is college-based studios. For the types of dance lessons, ballet is more […]

See All
We have detected unusual activity on your device.
Please verify your identity to continue.
Note: This verification step won't sign you in. If you have a premium account, please log in to access the service as usual.
Google/Gmail Verification
Or verify using Email/Code
We've sent a verification code to:
youremail@gmail.com (Not your email?)
Enter it below to complete the verification process.
Ensure your email address is correct, your inbox is not full, and you check your spam folder. If no email arrives, consider using an alternative email.
You will need a Premium plan to perform your action!
Note: If you already have a premium account, please log in to access our services as usual.

Plans & Pricing

Our mission is to make quality education accessible for everyone.
However, to keep our hardworking team running and this service alive, we genuinely need your support!
By opting for a premium plan, not only do you sustain us in achieving the mission, but you also unlock advanced features to enrich your learning experience.

Free

For learners who aren't pressed for time

What's included on Free
100+ Cambridge IELTS Tests
Instant IELTS Writing Task 1 & 2 Evaluation (2 times/month)
Instant IELTS Speaking Part 1, 2, & 3 Evaluation (2 times/month)
Instant IELTS Writing Task 1 & 2 Essay Generator (2 times/month)
500+ Dictation & Shadowing Exercises
100+ Pronunciation Exercises
Flashcards
Other Advanced Tools

Premium

For those serious about advancing their English proficiency, and for IELTS candidates aspiring to boost their band score by 1-2 points (especially in writing & speaking) in just 30 days or less

What's included on Premium
Save Your IELTS Test Progress & Analyze Mistakes By Question Type
Save Your Own Flashcard Sets & Use Them On Any Device
Unlock All Courses, IELTS Tests, Section & Part Practice
Unlimited AI Conversations
Unlimited AI Writing Enhancement Exercises
Unlimited IELTS Writing Task 1 & 2 Evaluation
Unlimited IELTS Speaking Part 1, 2, & 3 Evaluation
Checked Answers Will Not Be Published
Unlimited IELTS Writing Task 1 & 2 Essay Generator
Unlimited IELTS Speaking Part 1, 2, & 3 Sample Generator
Unlimited Usage Of Advanced Tools & AI Features
Priority Support within 24h (12-month plan only)

Due to the nature of our service and the provided free trials, payments are non-refundable.