🔥 Today Only: Save 30% on Premium — Offer Ends Soon! - Upgrade Now!
Multiple Graphs

Band 4+: The graphs below show the number of medals won by the top five countries in the summer and winter Olympics. Summarise the information by selecting and reporting the main features, and make comparisons where relevant.

Image for topic: The graphs below show the number of medals won by the top five countries in the summer and winter Olympics. Summarise the information by selecting and reporting the main features, and make comparisons where relevant.
Our system will evaluate the answer based on this AI-generated description.
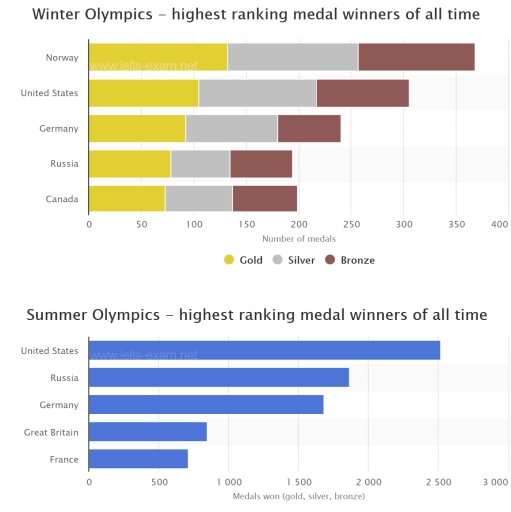
The image consists of two bar charts depicting the highest ranking medal winners of all time in the Winter and Summer Olympics. The Winter Olympics chart displays Norway with approximately 368 medals (132 gold, 125 silver, 111 bronze), the United States with around 305 medals (105 gold, 112 silver, 88 bronze), Germany with approximately 240 medals (92 gold, 88 silver, 60 bronze), Russia with about 234 medals (81 gold, 64 silver, 89 bronze), and Canada with around 199 medals (73 gold, 64 silver, 62 bronze). The Summer Olympics chart shows the United States with over 2,500 medals (1022 gold, 795 silver, 706 bronze), Russia with around 1,865 medals (590 gold, 486 silver, 489 bronze), Germany with approximately 1,346 medals (428 gold, 444 silver, 474 bronze), Great Britain with about 883 medals (263 gold, 295 silver, 325 bronze), and France with around 780 medals (248 gold, 276 silver, 256 bronze).
Given the complexity of the image, the above description may not be entirely accurate.
Note: Both the topic and the answer were created by one of our users.

The two bar graphs illustrate how many medals were won in water olympics in five country (Norway, US, Germany, Russia, and Canada) as well as the amount of medals in summer olympics in five country (US, Russia Germany, France, Great Britain). The medals are given in gold, silver, and bronze.

Overall, The Norway was the highest ranking medal winners in winter olympics over the period given whereas US was the most medal winners in summer olympics.

In terms of winter olympics, Canada was the lowest ranking gold medal winners at under 100 as opposed to Russia exhibited at least ranking silver medal winners to about 70. Furthermore, the Norway medal winners displayed maximum ranking bronze medal victors to approximately 100.

On the other hand, in summer olympics, France was the minimum ranking medal to above 500. However, Russia’s medal winners was higher than Germany (around 1800 and 1600 medals respectively). Lastly, France showed fewest ranking medal champion to below 500.

Word Count: 160

Answers On The Same Topic:

The graphs below show the number of medals won by the top five countries in the summer and winter Olympics. Summarise the information by selecting and reporting the main features, and make comparisons where relevant.

The diagram illustrates the number of medals won by the top five countries in the Summer and Winter Olympics. Overall, Norway is the country with the highest number of medals in the Winter Olympics, whereas the USA leads in the Summer Olympics by a considerable margin. Notably, more medals are won in the Summer Olympics […]

The graphs below show the number of medals won by the top five countries in the summer and winter Olympics. Summarise the information by selecting and reporting the main features, and make comparisons where relevant.

The bar charts compare the total number of medals won by the top five countries in the Winter and Summer Olympic Games. Overall, Norway dominated the Winter Olympics in terms of total medals, while the United States was by far the most successful nation in the Summer Olympics. In general, medal totals were significantly higher […]

The graphs below show the number of medals won by the top five countries in the summer and winter Olympics. Summarise the information by selecting and reporting the main features, and make comparisons where relevant.

The graphs show the number of medals won by the top five countries in the Summer and Winter Olympics. Overall, Norway won the highest number of medals in the Winter Olympics, while the United States was the top country in the Summer Olympics. In the Winter Olympics, Norway ranked first with around 370 medals in […]

The graphs below show the number of medals won by the top five countries in the summer and winter Olympics. Summarise the information by selecting and reporting the main features, and make comparisons where relevant.

The graphs compare the total number of medals won by the top five countries in the Winter and Summer Olympics throughout history. Overall, the United States is the dominant nation in the Summer Olympics, while Norway leads in the Winter Games. Another noticeable trend is that medal counts in the Summer Olympics are significantly higher […]

See All

Other Topics:

The bar graph shows the number of college students who got otvarious sporting events. The pie chart shows the percentage of students going or not going to the event.

The bar graph illustrates the amount of college students who got otvarious sporting events. The pie chart illustrates the percentage of students attendance on event. Overall, a significant majority of surveyed students do not attend sporting events at all. Among those who do attend, football is overwhelmingly popular with male students, whereas tennis attracts the […]

The provided charts illustrate the data about various dance groups and their places for young generations in Australia

Based on the chart above, it is shown that most of young people in Australia use private studio as their place to attend their dance classes by 48%. The lowest is being college-based studios whereas the percentage of it is 10% use for dance classes. Other locations such as school halls and community halls are […]

The pie chart below show the percentage of volunteers by organizations in the years 2008 and 2014.

The two pie charts illustrate the proportion of different organisations’ volunteers in two years (2008 and 2014). Overall, educational organisations accounted for the largest proportion, whereas environmental organisations were the most common category at the end. Starting from 2008, the educational and environmental categories accounted for almost a fifth. However, sport and others, constituting 15%, […]

The maps illustrate the layout of Oakwood City Park in 1990 and 2020.

The maps demonstrate how oakwood city park has changed over three decades, from 1990 to 2020. In general, the park underwent significant redevelopment over the given period, becoming more modern. The woodland, fountain and café were removed and replaced by car park, rose garden and a restaurant, while the playground was expanded. In 1990, woodland […]

The pie charts show the results of a survey in which undergraduates and postgraduates asked about the range of books and non-printed materials in their library.

The two maps illustrate the results of a survey in which undergraduates and postgraduates were asked about the range of books and non-printed materials in their school library. Overall, it is clear that undergraduates percentage of range of books as very good and of range of non printed materials as not good, with print materials […]

See All
We have detected unusual activity on your device.
Please verify your identity to continue.
Note: This verification step won't sign you in. If you have a premium account, please log in to access the service as usual.
Google/Gmail Verification
Or verify using Email/Code
We've sent a verification code to:
youremail@gmail.com (Not your email?)
Enter it below to complete the verification process.
Ensure your email address is correct, your inbox is not full, and you check your spam folder. If no email arrives, consider using an alternative email.
You will need a Premium plan to perform your action!
Note: If you already have a premium account, please log in to access our services as usual.

Plans & Pricing

Our mission is to make quality education accessible for everyone.
However, to keep our hardworking team running and this service alive, we genuinely need your support!
By opting for a premium plan, not only do you sustain us in achieving the mission, but you also unlock advanced features to enrich your learning experience.

Free

For learners who aren't pressed for time

What's included on Free
100+ Cambridge IELTS Tests
Instant IELTS Writing Task 1 & 2 Evaluation (2 times/month)
Instant IELTS Speaking Part 1, 2, & 3 Evaluation (2 times/month)
Instant IELTS Writing Task 1 & 2 Essay Generator (2 times/month)
500+ Dictation & Shadowing Exercises
100+ Pronunciation Exercises
Flashcards
Other Advanced Tools

Premium

For those serious about advancing their English proficiency, and for IELTS candidates aspiring to boost their band score by 1-2 points (especially in writing & speaking) in just 30 days or less

What's included on Premium
Save Your IELTS Test Progress & Analyze Mistakes By Question Type
Save Your Own Flashcard Sets & Use Them On Any Device
Unlock All Courses, IELTS Tests, Section & Part Practice
Unlimited AI Conversations
Unlimited AI Writing Enhancement Exercises
Unlimited IELTS Writing Task 1 & 2 Evaluation
Unlimited IELTS Speaking Part 1, 2, & 3 Evaluation
Checked Answers Will Not Be Published
Unlimited IELTS Writing Task 1 & 2 Essay Generator
Unlimited IELTS Speaking Part 1, 2, & 3 Sample Generator
Unlimited Usage Of Advanced Tools & AI Features
Priority Support within 24h (12-month plan only)

Due to the nature of our service and the provided free trials, payments are non-refundable.