Our system will evaluate the answer based on this AI-generated description.
The image displays a multicolored line graph indicating the percentage of involuntary part-time workers as a percentage of total employment across multiple countries between the years 2005 and 2014. Specifically: Australia started at ~2.5% in 2005 peaked ~4% around 2011, Austria fluctuated between ~1% to ~2.5%, Belgium ranged between ~3% to ~4%, Canada from ~1.5% to over 3%, Chile ~1% initially rising up to ~7%, Czech ~1.5% peaking at ~2.5%, Denmark ~1% to ~3%, Finland from ~2.5% to ~4.5%, France ~5.5% to ~6.5%, Germany 2.5% up to 4%, Greece increased from ~4% to 9%, Hungary stable around 2%, Iceland minimal variation around 1.5%, Ireland peaked at ~6%, Israel increased from ~2% to ~3.5%, Italy from ~6.5% to ~11%, Japan ~2% to ~5%, Korea stable around ~1%, Latvia ~2% to ~4.5%, Lithuania ~1% to ~4%, Luxembourg from ~1.5% to ~3.5%, Mexico stable around 1.5%, Netherlands ~4% to ~5%, New Zealand ~1.5% to ~4%, Norway ~1.5% to ~3%, Poland ~2% to ~4%, Portugal ~2% to ~6%, Slovakia d ~3%, Slovenia ~2% to 6%, Spain sharply increased from ~4% to ~7%, Sweden ~3% to ~4%, Switzerland minimal fluctuation around ~2%, Turkey ~2% to ~3%, UK ~3% to ~4.5%, USA ~2.5% to ~4.5%, OECD average started near ~4% increasing to ~6%.
Given the complexity of the image, the above description may not be entirely accurate.
Skyrocket your IELTS band score by 1-2 points in under a month with our premium plan!
Note: Both the topic and the answer were created by one of our users.
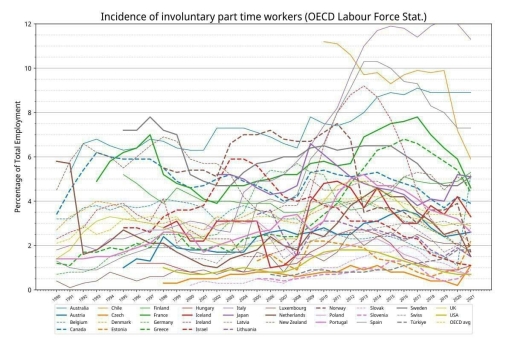
The line graph illustrates the percentage of involuntary part-time workers as a proportion of total employment in OECD countries between 1990 and 2021.
Overall, the proportion of involuntary part-time employees generally increased in many countries over the period. The highest figures were recorded in several European nations after the global financial crisis, while a number of countries maintained relatively low and stable rates throughout the timeframe.
At the beginning of the period, most countries reported levels below 6%, with only a few exceeding this figure. Throughout the 1990s and early 2000s, fluctuations were relatively moderate, as the majority of nations remained within a range of approximately 1% to 7%.
A more noticeable change occurred after 2008. In many OECD countries, the share of involuntary part-time workers rose considerably, reflecting a deterioration in labour market conditions. Some countries experienced sharp increases, reaching peaks of around 10-12% during the first half of the 2010s. By contrast, several nations continued to record comparatively low percentages, generally below 3%.
Towards the end of the period, trends became more mixed. While a number of countries saw gradual declines from their peak levels, others remained relatively stable. Nevertheless, the gap between the highest and lowest figures persisted, with some countries recording rates close to 12%, compared with less than 1% in others by 2021.
Word Count: 218
