24 Hours Only: Get 39% OFF on Our Premium Plan - Check Out Now!
Line Graph

Band 9: The line graph below shows the annual revenue generated from coffee production in five different countries (Madagascar, Philippines, Luxembourg, Tanzania, and Albania) throughout the year 2018. Summarize the information by selecting and reporting the main features, and make comparisons where relevant. Write at least 150 words.

Image for topic: The line graph below shows the annual revenue generated from coffee production in five different countries (Madagascar, Philippines, Luxembourg, Tanzania, and Albania) throughout the year 2018. Summarize the information by selecting and reporting the main features, and make comparisons where relevant. Write at least 150 words.
Our system will evaluate the answer based on this AI-generated description.
The image displays a line chart titled 'Annual Coffee Production Revenue (Millions USD) in 2018' for five countries. In the year 2018, the monthly revenue for the Philippines was: Jan 80M, Feb ~100M, Mar ~110M, Apr ~130M, May ~155M, Jun ~180M, Jul ~205M, Aug ~230M, Sep ~270M, Oct ~320M, Nov ~360M, and Dec 420M. Madagascar's revenue was Jan ~50M, Feb ~70M, Mar ~60M, Apr ~90M, May ~100M, Jun ~125M, Jul ~190M, Aug ~260M, Sep 350M, Oct ~300M, Nov ~295M, and Dec ~240M. Tanzania's revenue figures were Jan ~225M, Feb ~250M, Mar ~270M, Apr ~280M, May ~285M, Jun ~260M, Jul ~240M, Aug ~220M, Sep ~200M, Oct ~180M, Nov ~165M, and Dec ~150M. Albania's revenue was Jan ~18M, Feb ~19M, Mar ~15M, Apr ~22M, May ~30M, Jun ~25M, Jul ~20M, Aug ~25M, Sep ~22M, Oct ~20M, Nov ~25M, and Dec ~30M. Luxembourg's revenue was Jan ~5M, Feb ~4M, Mar ~3M, Apr ~4M, May ~6M, Jun ~5M, Jul ~4M, Aug ~3M, Sep ~2M, Oct ~2M, Nov ~1M, and Dec ~1M.
Given the complexity of the image, the above description may not be entirely accurate.
Note: Both the topic and the answer were created by one of our users.

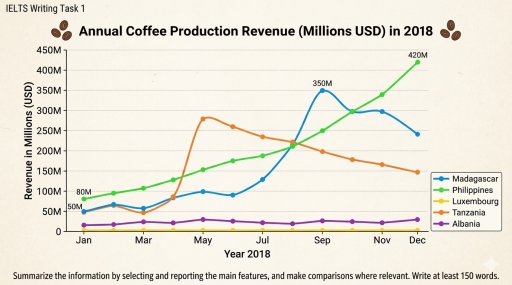
The line graph compares the monthly revenue generated from coffee production in five distinct countries – the Philippines, Madagascar, Tanzania, Albania, and Luxembourg – over the course of 2018.

Overall, the Philippines and Madagascar experienced the most significant growth, ending the year with the highest revenues. Conversely, Albania and Luxembourg saw minimal fluctuations, with Luxembourg generating virtually no revenue from coffee production throughout the entire period.

The Philippines began the year as the leader, with $80 million in January, and maintained a steady, consistent upward trajectory to finish the year at a peak of $420 million. Madagascar followed a more volatile path – after remaining under $100 million until July, it saw a dramatic surge to $350 million in September before declining to $240 million by December.

Tanzania exhibited a unique trend, with revenue spiking sharply in May to nearly $280 million before entering a gradual decline for the remainder of the year, ending at $150 million. In stark contrast, Albania’s revenue remained stagnant, hovering consistently around the $20 million mark. Evidently, Luxembourg’s coffee industry recorded negligible figures – flatlining at the bottom of the scale.

Word Count: 186

Other Topics:

Task 1: The chart below shows the price in Euros of 800 grams of four types of bread in one European country from 2001 to 2005. Summarize the information by selecting and reporting the main features, and make comparisons where relevant.

The line graph compares the prices for 800 grams, in euros, of four bread types in a European country between 2001 and 2005. Overall, brown bread ended the period as the most expensive variety, whereas rye remained the cheapest throughout the timeframe. Wholegrain showed the greatest fluctuation, peaking in 2002 before falling back, while the […]

he graph below shows the number of immigrants to there countries from 1990 to 2001. Summarise the information by selecting and reporting the main features, and make comparisons where relevant.

The line graph illustrates information about the figure of immigrants in three countries from 1990 to 2001 Overall,the USA showed the highest number of immigrants throughout the period. In addition Canada and Australia’s immigrant population was much lower in the graph. These countries showed small increases. In 1991, the figure of Usa’s immigrant population was […]

The graph below shows the changing patterns of access to modern technology in homes in the UK. Summarize by selecting and reporting the main features and make comparisons where relevant

The graph illustrates the trend of proportions of household with the access of modern technology in United kingdom over a period between 1994 and 2008. Overall, the upward trend of accessing all technologies represents that with the development and advancement of modern technologies households access to these also technologies also increases. Firstly, In early time […]

The number of tourists visiting Malaysia and Dubai from 1995 to 2003 is presented below

The line graph illustrates the number of tourists visiting Malaysia and Dubai between 1995 and 2003, measured in thousands. Overall, tourist numbers increased in both countries over the period, although Dubai experienced much more rapid growth and eventually surpassed Malaysia after entering the new millenium. While Malaysia saw steady growth until 2001, visitor numbers declined […]

The graph below shows the number of enquiries received by the Tourist Information Office in one city over a six-month period in 2011.

The line graph illustrates how many number of of enquiries are received by the tourist information office in one particular city in 2011 between six months, from January to June. Overall, number of questions reached the office in person and by telephone significantly increased, while sending letter/email showed dramatic fall over the period. In person […]

The line graph below gives informatiom about the number of visitors to three London museums between June and September 2013.

The line graph shows information about three different London museums such as the British Museum, the Science Museum, and the Natural History Museum, and the number of visitors from June to September 2013. The information in the line graph summarises the main features by selecting and reporting them, and also makes comparisons where relevant. Overall, […]

See All
We have detected unusual activity on your device.
Please verify your identity to continue.
Note: This verification step won't sign you in. If you have a premium account, please log in to access the service as usual.
Google/Gmail Verification
Or verify using Email/Code
We've sent a verification code to:
youremail@gmail.com (Not your email?)
Enter it below to complete the verification process.
Ensure your email address is correct, your inbox is not full, and you check your spam folder. If no email arrives, consider using an alternative email.
You will need a Premium plan to perform your action!
Note: If you already have a premium account, please log in to access our services as usual.

Plans & Pricing

Our mission is to make quality education accessible and free for everyone.
However, to keep our hardworking team running and this service alive, we genuinely need your support!
By opting for a premium plan, not only do you sustain us in achieving the mission, but you also unlock advanced features to enrich your learning experience.

Free

For learners who aren't pressed for time

What's included on Free
1000+ IELTS Tests & Samples
Instant IELTS Writing Task 1 & 2 Evaluation (2 times/month)
Instant IELTS Speaking Part 1, 2, & 3 Evaluation (5 times/month)
Instant IELTS Writing Task 1 & 2 Essay Generator (2 times/month)
500+ Dictation & Shadowing Exercises
100+ Pronunciation Exercises
Flashcards
Other Advanced Tools

Premium

For those serious about advancing their English proficiency, and for IELTS candidates aspiring to boost their band score by 1-2 points (especially in writing & speaking) in just 30 days or less

What's included on Premium
Save Your IELTS Test Progress
Unlock All Courses & Content
Unlimited AI Conversations
Unlimited AI Writing Enhancement Exercises
Unlimited IELTS Writing Task 1 & 2 Evaluation
Unlimited IELTS Speaking Part 1, 2, & 3 Evaluation
Checked Answers Will Not Be Published
Unlimited IELTS Writing Task 1 & 2 Essay Generator
Unlimited IELTS Speaking Part 1, 2, & 3 Sample Generator
Unlimited Usage Of Advanced Tools

Due to the nature of our service and the provided free trials, payments are non-refundable.
Nếu bạn là người Việt Nam và không có hoặc không muốn trả bằng credit/debit cards, bạn có thể thanh toán bằng phương thức chuyển khoản:


Chọn gói:
279,000₫ 157,000 ₫ cho gói 1 tháng (chỉ 5,233₫/ngày)
819,000₫ 397,000 ₫ cho gói 3 tháng (chỉ 4,411₫/ngày)
1,649,000₫ 667,000 ₫ cho gói 6 tháng (chỉ 3,706₫/ngày)
3,299,000₫ 857,000 ₫ cho gói 12 tháng (chỉ 2,381₫/ngày)


Sau khi chuyển khoản, vui lòng đợi trình duyệt tự động điều hướng bạn trở lại Engnovate và bạn sẽ ngay lập tức nhận được mã kích hoạt tài khoản premium.
Nếu có lỗi xảy ra, bạn có thể liên hệ với team thông qua một trong các phương thức: email đến helloengnovate@gmail.com hoặc nhắn tin qua facebook.com/engnovate.
Vì toàn bộ công cụ trên website đều có thể sử dụng thử miễn phí, Engnovate không hỗ trợ hoàn tiền.