Our system will evaluate the answer based on this AI-generated description.
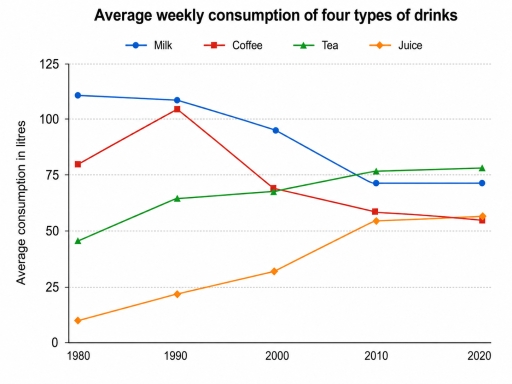
The image features a line graph titled "Average weekly consumption of four types of drinks", with the vertical y-axis measuring "Average consumption in litres" marked from 0 to 125 in increments of 25, and the horizontal x-axis displaying years: 1980, 1990, 2000, 2010, and 2020. The legend lists four drink types: Milk, Coffee, Tea, and Juice. In 1980, consumption in litres recorded approximately 111 for Milk, 80 for Coffee, 45 for Tea, and 10 for Juice. In 1990, values were approximately 109 for Milk, 105 for Coffee, 64 for Tea, and 22 for Juice. In 2000, consumption values stood at approximately 95 for Milk, 69 for Coffee, 67 for Tea, and 32 for Juice. In 2010, figures were approximately 71 for Milk, 58 for Coffee, 77 for Tea, and 54 for Juice. In 2020, consumption measured approximately 71 for Milk, 55 for Coffee, 78 for Tea, and 56 for Juice.
Given the complexity of the image, the above description may not be entirely accurate.
Skyrocket your IELTS band score by 1-2 points in under a month with our premium plan!
Note: Both the topic and the answer were created by one of our users.
The line graph illustrates the average weekly consumption of four different types of drinks namely,milk,coffee,tea,and juice in a European county from 1980 to 2020.
Overall,all off thes foure different types of drinks experienced fluctuation throughout the period,where the consumption of tea and juice an upward trend.In contrast,the milk and coffee was dawnward trend in the given period.
in 1980, approximately 48 litres the consumed of tea, while the figure for juice was under 25 litres.Over the following years,the amount of consumption of drinks of tea increased dramatically to around 76 litres in 2020.Meanwhile,the amount of drink for juice saw an increased of almost 50 litres over the same years.
the other two popular consumption of drinks in a European country were the milk and coffee between 1080 and 2020.During the period consumed of milk decreased slightly from 115 litres to nearly 75 litres in 40 years.finally, In 1980,the juice was two most popular drinks figure, which picked at above 75 litres in 1980.However the amount of consumtion drinks diclined continuously to less than under 55 litres in 2020.
Word Count: 178
