Our system will evaluate the answer based on this AI-generated description.
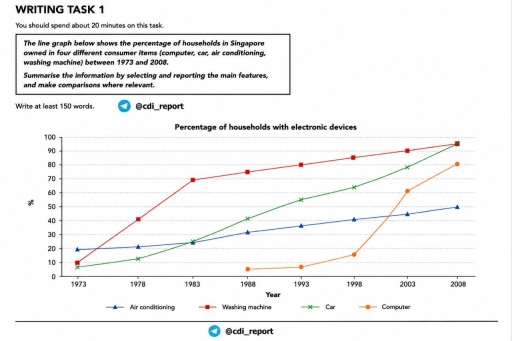
The image features a line graph titled "Percentage of households with electronic devices". The vertical axis is labeled "%" and ranges from 0 to 100 with increments of 10, while the horizontal axis is labeled "Year" with points at 1973, 1978, 1983, 1988, 1993, 1998, 2003, and 2008. The legend lists four categories: Air conditioning, Washing machine, Car, and Computer. For Air conditioning, data points are approximately 19% in 1973, 21% in 1978, 24% in 1983, 31% in 1988, 36% in 1993, 41% in 1998, 45% in 2003, and 50% in 2008. For Washing machine, values are 10% in 1973, 41% in 1978, 69% in 1983, 75% in 1988, 80% in 1993, 85% in 1998, 90% in 2003, and 95% in 2008. For Car, values stand at approximately 7% in 1973, 13% in 1978, 25% in 1983, 41% in 1988, 55% in 1993, 64% in 1998, 78% in 2003, and 95% in 2008. For Computer, values are absent prior to 1988, then register at approximately 5% in 1988, 7% in 1993, 16% in 1998, 61% in 2003, and 81% in 2008.
Given the complexity of the image, the above description may not be entirely accurate.
Skyrocket your IELTS band score by 1-2 points in under a month with our premium plan!
Note: Both the topic and the answer were created by one of our users.
The line graph illustrates the changes of households in Singapore who owned four different consumer items – computer, car, air conditioning, and washing machine – between 1973 and 2008. Overall, all figures adhered to a rising trend, albeit to varying degrees. Households with ownership of washing machine and car were the highest consumer items, whereas the reverse was true for air conditioning, which experienced minimal increase throughout the period.
In 1973, both figures for washing machine and car started the trend at 10%. These figures then followed a similar pattern, with the former increasing sharply from just 10% to a peak of 100%, and the latter witnessing a gradual increase from 10% to a high of 100%. As for households who owned computer, in the initial years, the figure was relatively low, after which it surged dramatically to 80% by the end of the period.
Regarding air conditioning, this consumer item was less popular compared to its rivals, with starting the trend at around 20% at the beginning of the period, followed by a steady increase throughout the period until reaching ultimately to 50% in 2008.
Word Count: 186
