Our system will evaluate the answer based on this AI-generated description.
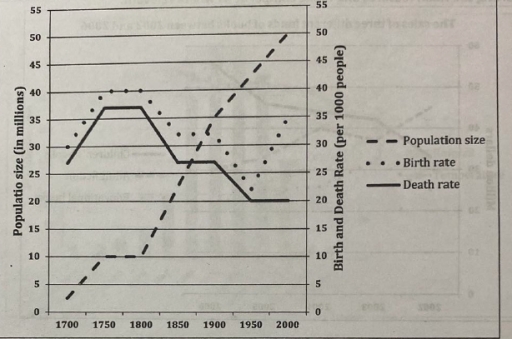
The image is a graph with two y-axes, the left one representing population size in millions, from 0 to 55 in increments of 5, and the right one representing birth and death rate per 1,000 people, from 0 to 55 in increments of 5. The x-axis represents the years 1700 to 2000 in increments of 50. There are three lines, one solid and two dotted, representing population size, birth rate, and death rate, respectively. The solid line indicates population size remains steady at 5 million from 1700 to 1750, then rises gradually to 10 million by 1800, reaches 15 million in 1850, and then increases sharply reaching 30 million by 1900, 45 million by 1950, and peak over 50 million by 2000. The dotted lines indicate birth and death rates, with the birth rate starting around 40 per 1,000 people in 1700, increasing to 45 around 1750, then declining to 35 by 1800, fluctuating between 35 and 40 until 1900, then dropping sharply to slightly above 15 in 1950 and stabilizing around 10 in 2000. The death rate starts at 35 per 1,000 people in 1700, rises to 45 in 1750, then drops steeply to slightly above 20 by 1800, fluctuates between 20 and 25 until 1900, then declines sharply to approximately 10 in 1950 and maintains a consistent 10 in 2000.
Given the complexity of the image, the above description may not be entirely accurate.
Skyrocket your IELTS band score by 1-2 points in under a month with our premium plan!
Note: Both the topic and the answer were created by one of our users.
The line graph illustrates the population size, birth rate, and death rate in England and Wales between 1700 and 2000.
Overall, the population increased continuously throughout the period despite fluctuations in the birth and death rates. In addition, the birth rate remained higher than the death rate in every year shown. The population reached its highest level in 2000, while the lowest figure was recorded in 1700.
In 1700, the population stood at approximately 2.5 million. It then rose steadily to 10 million by 1750 and remained unchanged until 1800. After that, the figure increased significantly, reaching around 20 million in 1850 and about 33 million in 1900. The upward trend continued, with the population growing to roughly 40 million in 1950 and peaking at 50 million in 2000.
Regarding birth and death rates, the birth rate was about 30 per 1,000 people in 1700 and climbed to around 40 by 1750, remaining at this level until 1800. It then declined gradually to approximately 32 in both 1850 and 1900 before falling to its lowest point of about 22 in 1950. However, the figure recovered and increased to around 33 by 2000.
Similarly, the death rate rose from about 27 per 1,000 people in 1700 to roughly 37 in 1750 and 1800. Afterward, it decreased to around 27 in both 1850 and 1900 before dropping further to 20 in 1950, where it remained unchanged until 2000.
Word Count: 236
