Our system will evaluate the answer based on this AI-generated description.
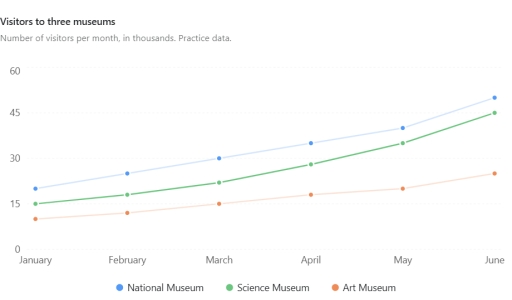
The image presents a line graph titled "Visitors to three museums" with the subtitle "Number of visitors per month, in thousands. Practice data." The vertical axis represents monthly visitors in thousands, graduated from 0 to 60 in increments of 15 (0, 15, 30, 45, 60), while the horizontal axis displays six consecutive months: January, February, March, April, May, and June. The legend lists three institutions: National Museum, Science Museum, and Art Museum. For National Museum, visitor counts are approximately 20 thousand in January, 25 thousand in February, 30 thousand in March, 35 thousand in April, 40 thousand in May, and 50 thousand in June. For Science Museum, values are 15 thousand in January, 18 thousand in February, 22 thousand in March, 28 thousand in April, 35 thousand in May, and 45 thousand in June. For Art Museum, counts are 10 thousand in January, 12 thousand in February, 15 thousand in March, 18 thousand in April, 20 thousand in May, and 25 thousand in June.
Given the complexity of the image, the above description may not be entirely accurate.
Skyrocket your IELTS band score by 1-2 points in under a month with our premium plan!
Note: Both the topic and the answer were created by one of our users.
The provided line graph comapes the quantity of visitors to three different museums per month from January to May, counted in thousands.
Overall, what stands out is that all three museums experienced an increase thhroughout the given period. It is also noteworthy that induviduals visited National museum the most in general during the period.
Focusing on National museum in January the number of visitors to National museum stood at 20.000 before rising minimally to 25.000 by Febuary , after wich by march, april and may it increased by 5.000 visitors each month. However in June the number of it reached the peak with 50.000 visitors and finished the chart.
Turning to Science museum in January the number of people who visited Science museum stood at just about 15.000, however by April it increased signifficantly to 28.000 visitors and in June it reached to it’s peak approximately 45.000 individuals who visited Science museum.
Finally , looking at the Art museum it started eith lowes numbers of visitors just about 10.000 , but by may the quantity of visitors to this museum reached 20.000, after wich in June this numbers incresed unnoticeably to 25.000 vistors and fiinished as a lowest rate
Word Count: 199
