🔥 Today Only: Save 30% on Premium — Offer Ends Soon! - Upgrade Now!
Line Graph

Band 6+: The line graph shows annual loans of four types of material from the Riverton library network from 2005 to 2025. Summarise the information by selecting and reporting the main features, and make comparisons where relevant.

Image for topic: The line graph shows annual loans of four types of material from the Riverton library network from 2005 to 2025. Summarise the information by selecting and reporting the main features, and make comparisons where relevant.
Our system will evaluate the answer based on this AI-generated description.
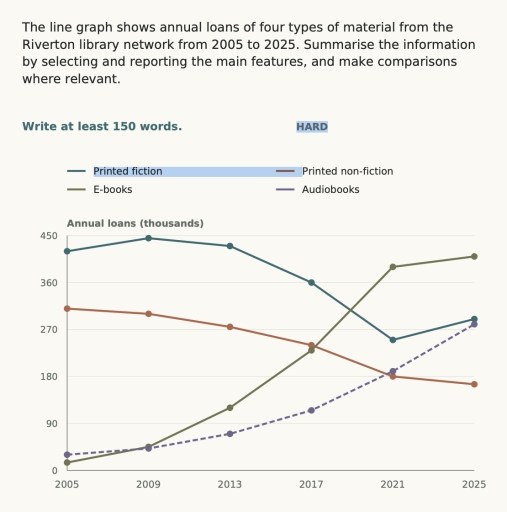
The image features a line graph with the vertical axis labeled 'Annual loans (thousands)' scaled from 0 to 450 in increments of 90 (0, 90, 180, 270, 360, 450) and the horizontal axis showing the years 2005, 2009, 2013, 2017, 2021, and 2025. The legend identifies four categories: Printed fiction, Printed non-fiction, E-books, and Audiobooks. Data points for Printed fiction are approximately 420 in 2005, 445 in 2009, 430 in 2013, 360 in 2017, 250 in 2021, and 290 in 2025. For Printed non-fiction, values are approximately 310 in 2005, 300 in 2009, 275 in 2013, 240 in 2017, 180 in 2021, and 165 in 2025. For E-books, values are approximately 15 in 2005, 42 in 2009, 120 in 2013, 230 in 2017, 390 in 2021, and 410 in 2025. For Audiobooks (dashed line), values are approximately 30 in 2005, 42 in 2009, 70 in 2013, 115 in 2017, 190 in 2021, and 280 in 2025.
Given the complexity of the image, the above description may not be entirely accurate.
Note: Both the topic and the answer were created by one of our users.

The graph represents information yearly loans of four different material from the Riverton library network from 2005 to 2025.

Overall, printed fiction lost its initial dominance, whereas e-books finished first. The annual loans of e-books and audiobooks rose steadily. Printed non-fiction lost value and became the smallest figure.

In 2009, printed fiction reached a peak for all time with approximately 450,000 loans. Thereafter, it fell gradually to around 220,000 loans in 2021. However, it increased slightly and stayed at above audiobooks.

E-books increased dramatically and dominated loans beween 2021 and 2025. In adittion, audiobooks overtooked printed non-ficton in 2021. In contrast, audiobooks stayed below of prined fiction at roughly 280,000 loans.

In terms of loans printed non-fiction never remained stable. By the end, printed non-fiction overtooked by e-books and audiobooks then displayed the lowest figure with around 170,000 loans. Printed non-fiction decreased gradually throughout the period, with only a few small fluctuations.

Word Count: 152

Other Topics:

The line graph below shows the number of visitors to a museum between 2005 and 2015.

The line graph illustrates the changes in number of museum visitors from 2005 to 2015. The data is measured in thousands. Overall, the visitors rate experienced a significant increase over the given period with the episode of plunge, followed by steady growth with a period of stability for short period of time. In 2005, the […]

Radio and television audiences in UK, October-December 1992

The diagram shows the average precentage of people reached by radio and television over the different day and night times, measured throughout a period of three months from October to December 1992. The graph illustrates that listening to the radio in the morning was very common and increased steadily in the early hours, whereas over […]

The graph below shows the percentage of female members of parliament in five European countries, from 2000 to 2012. Summarise the information by selecting and reporting the main features, and make comparison where relevant.

The line graph presents data on the proportion of women who served in parliament in five European nations between 2000 and 2012. Overall, all countries in question experienced an increase of varying degrees. While the proportion of female members of parliament in Germany was the highest initially, it was Belgium that had the most women […]

The graph and the table show the average monthly temperatures and annual hours received by three major cities.

While the given line graph illustrates the average temperatures per month in three different cities, the table provides information about the sunshine hours per year in those cities. Overall, there is a same pattern in the figure for average temperatures in London and New York, while opposite changes can be seen in that of Sydney. […]

The graph below shows the percentage of female members of parliament in five European countries, from 2000 to 2012. Summarise the information by selecting and reporting the main features, and make comparison where relevant.

The line graph presents data on the proportion of women who served in parliament in five European nations between 2000 and 2012. Overall, all countries in question experienced an increase of varying degrees. While the proportion of female members of the parliament in Germany was the highest initially, it was Belgium that had the most […]

See All
We have detected unusual activity on your device.
Please verify your identity to continue.
Note: This verification step won't sign you in. If you have a premium account, please log in to access the service as usual.
Google/Gmail Verification
Or verify using Email/Code
We've sent a verification code to:
youremail@gmail.com (Not your email?)
Enter it below to complete the verification process.
Ensure your email address is correct, your inbox is not full, and you check your spam folder. If no email arrives, consider using an alternative email.
You will need a Premium plan to perform your action!
Note: If you already have a premium account, please log in to access our services as usual.

Plans & Pricing

Our mission is to make quality education accessible for everyone.
However, to keep our hardworking team running and this service alive, we genuinely need your support!
By opting for a premium plan, not only do you sustain us in achieving the mission, but you also unlock advanced features to enrich your learning experience.

Free

For learners who aren't pressed for time

What's included on Free
100+ Cambridge IELTS Tests
Instant IELTS Writing Task 1 & 2 Evaluation (2 times/month)
Instant IELTS Speaking Part 1, 2, & 3 Evaluation (2 times/month)
Instant IELTS Writing Task 1 & 2 Essay Generator (2 times/month)
500+ Dictation & Shadowing Exercises
100+ Pronunciation Exercises
Flashcards
Other Advanced Tools

Premium

For those serious about advancing their English proficiency, and for IELTS candidates aspiring to boost their band score by 1-2 points (especially in writing & speaking) in just 30 days or less

What's included on Premium
Save Your IELTS Test Progress & Analyze Mistakes By Question Type
Save Your Own Flashcard Sets & Use Them On Any Device
Unlock All Courses, IELTS Tests, Section & Part Practice
Unlimited AI Conversations
Unlimited AI Writing Enhancement Exercises
Unlimited IELTS Writing Task 1 & 2 Evaluation
Unlimited IELTS Speaking Part 1, 2, & 3 Evaluation
Checked Answers Will Not Be Published
Unlimited IELTS Writing Task 1 & 2 Essay Generator
Unlimited IELTS Speaking Part 1, 2, & 3 Sample Generator
Unlimited Usage Of Advanced Tools & AI Features
Priority Support within 24h (12-month plan only)

Due to the nature of our service and the provided free trials, payments are non-refundable.